## Bar Chart: Used Weights [%] per Layer
### Overview
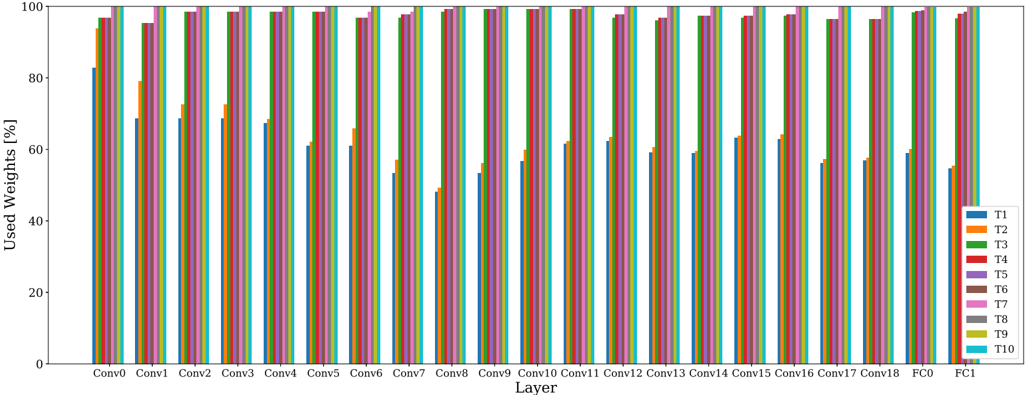
This image is a grouped bar chart illustrating the "Used Weights [%]" across 21 distinct neural network layers (labeled Conv0 through FC1). The chart compares 10 different experimental series (labeled T1 through T10) to show how the percentage of active or "used" weights varies across these layers.
### Components/Axes
* **X-Axis (Horizontal):** Labeled "Layer". It contains 21 categorical markers: Conv0, Conv1, Conv2, Conv3, Conv4, Conv5, Conv6, Conv7, Conv8, Conv9, Conv10, Conv11, Conv12, Conv13, Conv14, Conv15, Conv16, Conv17, Conv18, FC0, FC1.
* **Y-Axis (Vertical):** Labeled "Used Weights [%]". The scale ranges from 0 to 100, representing the percentage of weights utilized.
* **Legend:** Located in the bottom-right corner of the chart. It maps the 10 series to specific colors:
* **T1:** Blue
* **T2:** Orange
* **T3:** Green
* **T4:** Red
* **T5:** Purple
* **T6:** Brown
* **T7:** Pink
* **T8:** Grey
* **T9:** Yellow/Gold
* **T10:** Cyan/Light Blue
### Detailed Analysis
The chart displays a grouped bar structure where each "Layer" category contains 10 bars corresponding to series T1 through T10 (ordered left to right).
**Trend Verification:**
* **Series Progression:** For every layer, the "Used Weights" percentage increases monotonically from T1 to T10. T1 (Blue) is consistently the lowest value, and T10 (Cyan) is consistently the highest value (at or near 100%).
* **Layer Sensitivity:** The values for the lower-numbered series (T1–T5) fluctuate significantly depending on the layer. They are highest in the early layers (Conv0–Conv5), drop to their minimums in the middle layers (Conv8–Conv12), and recover slightly in the later layers (Conv13–FC1).
**Representative Data Points (Approximate):**
* **Conv0:** T1 is ~83%, T2 is ~93%, and T3–T10 are between ~97% and 100%.
* **Conv8 (The "Bottleneck"):** This layer shows the lowest values for the lower series. T1 is ~48%, T2 is ~49%, T3 is ~54%, T4 is ~57%, T5 is ~66%, while T6–T10 remain high (ranging from ~97% to 100%).
* **FC1 (Final Layer):** T1 is ~55%, T2 is ~56%, T3 is ~60%, T4 is ~97%, and T5–T10 are at ~98% to 100%.
### Key Observations
* **Consistent Ceiling:** Series T10 is consistently at or near 100% "Used Weights" across all layers, indicating it is likely the baseline or unpruned model.
* **The "Dip" Pattern:** There is a distinct U-shaped trend for the lower-numbered series (T1–T5). The "Used Weights" percentage is high at the start (Conv0), drops significantly in the middle layers (Conv8–Conv12), and rises again toward the end (FC1).
* **Clustering:** The series T6–T10 are tightly clustered near the 100% mark across almost all layers, suggesting that these configurations are much less aggressive in their weight reduction compared to T1–T5.
### Interpretation
This data strongly suggests a **neural network pruning or compression experiment**.
* **Pruning Intensity:** The series T1 through T10 likely represent different levels of pruning intensity, where T1 is the most aggressive (removing the most weights) and T10 is the least aggressive (keeping the most weights).
* **Layer Importance:** The "dip" observed in the middle layers (Conv8–Conv12) indicates that these specific layers are the most "compressible" or redundant within the network architecture. The algorithm (or the pruning method) has identified these layers as having the most weights that can be set to zero (or "unused") without affecting the series T1–T5 as much as the others.
* **Architectural Sensitivity:** The fact that the values recover slightly in the FC (Fully Connected) layers suggests that the final layers of this specific network architecture are more sensitive to pruning than the middle convolutional layers, requiring a higher percentage of "Used Weights" to maintain performance.