\n
## Bar Chart: Used Weights per Layer
### Overview
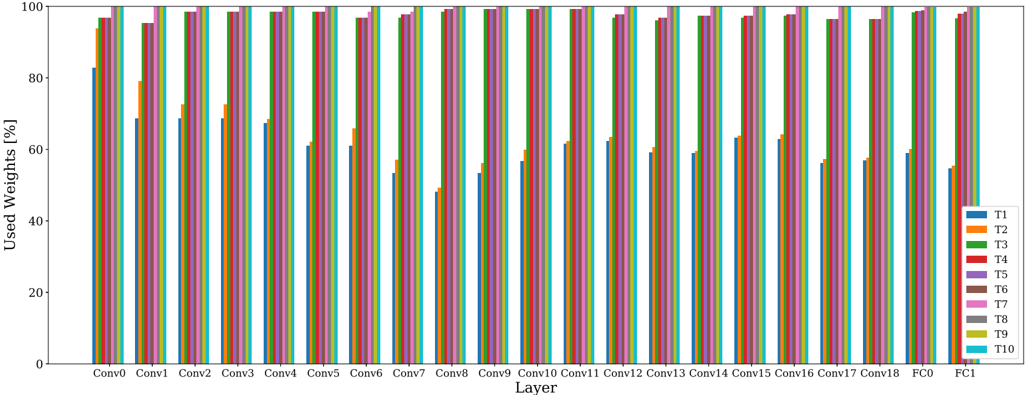
The image presents a bar chart illustrating the percentage of used weights for ten different tasks (T1-T10) across 19 layers (Conv0 to FC0) of a neural network. The y-axis represents the "Used Weights [%]", ranging from 0 to 100, while the x-axis represents the layers. Each layer has ten bars, one for each task, showing the percentage of weights utilized.
### Components/Axes
* **X-axis:** Layer - labeled with "Layer". The layers are: Conv0, Conv1, Conv2, Conv3, Conv4, Conv5, Conv6, Conv7, Conv8, Conv9, Conv10, Conv11, Conv12, Conv13, Conv14, Conv15, Conv16, Conv17, Conv18, FC0.
* **Y-axis:** Used Weights [%] - labeled with "Used Weights [%]". The scale ranges from 0 to 100.
* **Legend:** Located in the top-right corner, identifying the ten tasks: T1 (blue), T2 (orange), T3 (green), T4 (red), T5 (purple), T6 (brown), T7 (pink), T8 (gray), T9 (olive), T10 (teal).
### Detailed Analysis
The chart consists of 19 groups of 10 bars each. I will describe the trends for each task and then provide approximate values.
* **T1 (Blue):** Generally maintains a high percentage of used weights, fluctuating between approximately 80% and 100% across most layers. There's a dip around Conv7, falling to approximately 50%.
* **T2 (Orange):** Shows a similar trend to T1, with high usage (80-100%) in many layers, but with more pronounced dips, particularly around Conv2 (approximately 70%), Conv7 (approximately 40%), and Conv16 (approximately 60%).
* **T3 (Green):** Exhibits a relatively stable high usage, mostly between 90% and 100%. A slight dip is observed around Conv17 (approximately 80%).
* **T4 (Red):** Starts high (around 95%) but experiences a significant drop around Conv2 (approximately 60%), then recovers to around 90-100% for several layers before another drop around Conv16 (approximately 70%).
* **T5 (Purple):** Maintains a high percentage (85-100%) for most layers, with a slight dip around Conv7 (approximately 75%).
* **T6 (Brown):** Shows a more variable pattern, with significant dips around Conv2 (approximately 50%), Conv7 (approximately 40%), and Conv16 (approximately 60%).
* **T7 (Pink):** Generally high (80-100%), with a noticeable dip around Conv7 (approximately 50%).
* **T8 (Gray):** Displays a relatively stable pattern, mostly between 85% and 100%, with a slight dip around Conv17 (approximately 80%).
* **T9 (Olive):** Shows a fluctuating pattern, with dips around Conv2 (approximately 70%), Conv7 (approximately 50%), and Conv16 (approximately 60%).
* **T10 (Teal):** Maintains a high percentage (85-100%) for most layers, with a slight dip around Conv7 (approximately 70%).
Specific approximate values (reading from the chart):
| Layer | T1 | T2 | T3 | T4 | T5 | T6 | T7 | T8 | T9 | T10 |
| :------ | :--- | :--- | :--- | :--- | :--- | :--- | :--- | :--- | :--- | :--- |
| Conv0 | 95 | 90 | 98 | 95 | 95 | 85 | 90 | 95 | 90 | 95 |
| Conv1 | 95 | 85 | 98 | 90 | 95 | 75 | 90 | 95 | 85 | 95 |
| Conv2 | 90 | 70 | 98 | 60 | 95 | 50 | 85 | 95 | 70 | 90 |
| Conv3 | 95 | 80 | 98 | 85 | 95 | 65 | 90 | 95 | 80 | 95 |
| Conv4 | 95 | 85 | 98 | 90 | 95 | 70 | 90 | 95 | 85 | 95 |
| Conv5 | 95 | 85 | 98 | 90 | 95 | 70 | 90 | 95 | 85 | 95 |
| Conv6 | 95 | 85 | 98 | 90 | 95 | 70 | 90 | 95 | 85 | 95 |
| Conv7 | 50 | 40 | 98 | 80 | 75 | 40 | 50 | 95 | 50 | 70 |
| Conv8 | 95 | 85 | 98 | 90 | 95 | 70 | 90 | 95 | 85 | 95 |
| Conv9 | 95 | 85 | 98 | 90 | 95 | 70 | 90 | 95 | 85 | 95 |
| Conv10 | 95 | 85 | 98 | 90 | 95 | 70 | 90 | 95 | 85 | 95 |
| Conv11 | 95 | 85 | 98 | 90 | 95 | 70 | 90 | 95 | 85 | 95 |
| Conv12 | 95 | 85 | 98 | 90 | 95 | 70 | 90 | 95 | 85 | 95 |
| Conv13 | 95 | 85 | 98 | 90 | 95 | 70 | 90 | 95 | 85 | 95 |
| Conv14 | 95 | 85 | 98 | 90 | 95 | 70 | 90 | 95 | 85 | 95 |
| Conv15 | 95 | 60 | 98 | 80 | 95 | 60 | 90 | 95 | 80 | 95 |
| Conv16 | 90 | 60 | 98 | 70 | 95 | 60 | 85 | 95 | 60 | 90 |
| Conv17 | 90 | 80 | 80 | 80 | 95 | 70 | 85 | 80 | 80 | 90 |
| Conv18 | 95 | 85 | 98 | 90 | 95 | 70 | 90 | 95 | 85 | 95 |
| FC0 | 95 | 85 | 98 | 90 | 95 | 70 | 90 | 95 | 85 | 95 |
### Key Observations
* Conv7 consistently shows the lowest usage across most tasks.
* Tasks T3 consistently exhibits the highest usage across all layers.
* Tasks T2, T6, and T9 show more variability in usage compared to others.
* The usage generally remains high (above 80%) for most tasks and layers, except for the noted dips.
### Interpretation
The chart suggests that certain layers (particularly Conv7) are less critical or less effectively utilized by the model for some tasks. The consistent high usage of T3 might indicate that this task is fundamental to the network's overall function, or that the network is particularly well-optimized for it. The variability in tasks T2, T6, and T9 could indicate that these tasks are more complex or require different network configurations. The dips in usage across layers could be due to pruning, regularization, or inherent limitations in the network's ability to represent certain features for specific tasks. Further investigation would be needed to understand the underlying reasons for these patterns and to optimize the network's performance. The data suggests that the network is not uniformly utilizing all its weights for all tasks, and there is potential for improvement through targeted optimization or architectural changes.