TECHNICAL ASSET FINGERPRINT
3e65e7500bbaf6b0146aadc7
Click to view fullscreen
Press ESC or click to close
FOUND IN PAPERS
EXPERT: healer-alpha-free VERSION 1
RUNTIME: free/openrouter/healer-alpha
INTEL_VERIFIED
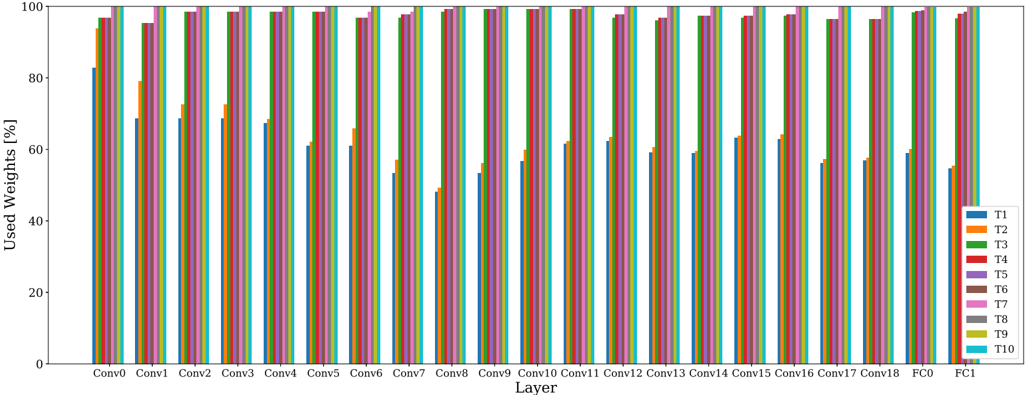
## Bar Chart: Used Weights Percentage Across Neural Network Layers
### Overview
This is a grouped bar chart illustrating the percentage of "Used Weights" across 20 distinct layers of a neural network. The layers progress from convolutional layers (Conv0 through Conv18) to fully connected layers (FC0 and FC1). For each layer, ten different data series (labeled T1 through T10) are compared, showing significant variation in weight usage between the series, particularly for T1 versus the others.
### Components/Axes
* **Chart Type:** Grouped Bar Chart.
* **Y-Axis:** Labeled **"Used Weights [%]"**. The scale runs from 0 to 100 with major tick marks at intervals of 20 (0, 20, 40, 60, 80, 100).
* **X-Axis:** Labeled **"Layer"**. It lists 20 categorical layers in order: `Conv0`, `Conv1`, `Conv2`, `Conv3`, `Conv4`, `Conv5`, `Conv6`, `Conv7`, `Conv8`, `Conv9`, `Conv10`, `Conv11`, `Conv12`, `Conv13`, `Conv14`, `Conv15`, `Conv16`, `Conv17`, `Conv18`, `FC0`, `FC1`.
* **Legend:** Positioned on the **right side** of the chart. It defines ten data series with associated colors:
* **T1:** Blue
* **T2:** Orange
* **T3:** Green
* **T4:** Red
* **T5:** Purple
* **T6:** Brown
* **T7:** Pink
* **T8:** Gray
* **T9:** Olive/Yellow-Green
* **T10:** Cyan
### Detailed Analysis
The chart displays the percentage of used weights for each of the ten series (T1-T10) within each layer. The values are approximate, derived from visual estimation against the y-axis scale.
**General Trend:** For any given layer, the bars for series T2 through T10 are consistently tall, typically ranging between 90% and 100%. In stark contrast, the bar for series T1 (blue) is significantly shorter in almost every layer, indicating a much lower percentage of used weights.
**Layer-by-Layer Data Points (Approximate % Used Weights):**
* **Conv0:** T1 ~83%. T2-T10: All appear to be at or very near 100%.
* **Conv1:** T1 ~69%. T2 ~79%. T3-T10: All appear to be at or very near 100%.
* **Conv2:** T1 ~70%. T2 ~72%. T3 ~73%. T4-T10: All appear to be at or very near 100%.
* **Conv3:** T1 ~69%. T2 ~72%. T3 ~73%. T4-T10: All appear to be at or very near 100%.
* **Conv4:** T1 ~68%. T2 ~69%. T3 ~70%. T4-T10: All appear to be at or very near 100%.
* **Conv5:** T1 ~61%. T2 ~62%. T3 ~63%. T4-T10: All appear to be at or very near 100%.
* **Conv6:** T1 ~61%. T2 ~65%. T3 ~66%. T4-T10: All appear to be at or very near 100%.
* **Conv7:** T1 ~54%. T2 ~57%. T3 ~58%. T4-T10: All appear to be at or very near 100%.
* **Conv8:** T1 ~49%. T2 ~50%. T3 ~51%. T4-T10: All appear to be at or very near 100%.
* **Conv9:** T1 ~53%. T2 ~58%. T3 ~59%. T4-T10: All appear to be at or very near 100%.
* **Conv10:** T1 ~57%. T2 ~59%. T3 ~60%. T4-T10: All appear to be at or very near 100%.
* **Conv11:** T1 ~62%. T2 ~63%. T3 ~64%. T4-T10: All appear to be at or very near 100%.
* **Conv12:** T1 ~63%. T2 ~64%. T3 ~65%. T4-T10: All appear to be at or very near 100%.
* **Conv13:** T1 ~60%. T2 ~61%. T3 ~62%. T4-T10: All appear to be at or very near 100%.
* **Conv14:** T1 ~59%. T2 ~60%. T3 ~61%. T4-T10: All appear to be at or very near 100%.
* **Conv15:** T1 ~63%. T2 ~64%. T3 ~65%. T4-T10: All appear to be at or very near 100%.
* **Conv16:** T1 ~63%. T2 ~64%. T3 ~65%. T4-T10: All appear to be at or very near 100%.
* **Conv17:** T1 ~57%. T2 ~58%. T3 ~59%. T4-T10: All appear to be at or very near 100%.
* **Conv18:** T1 ~57%. T2 ~58%. T3 ~59%. T4-T10: All appear to be at or very near 100%.
* **FC0:** T1 ~60%. T2-T10: All appear to be at or very near 100%.
* **FC1:** T1 ~55%. T2-T10: All appear to be at or very near 100%.
### Key Observations
1. **Systematic Divergence of T1:** The most prominent feature is the consistent and significant underperformance of series T1 (blue bars) in terms of used weights compared to all other series (T2-T10). This gap is present in every single layer.
2. **High Saturation for T2-T10:** Series T2 through T10 exhibit near-maximum weight usage (approaching 100%) across nearly all layers, especially in the later convolutional layers and both fully connected layers.
3. **Layer-Dependent Variation for T1:** The used weights for T1 show a clear pattern across the convolutional layers. It starts relatively high (~83% at Conv0), dips to a low point around Conv8 (~49%), and then shows a partial recovery in the later convolutional layers before dropping again in the final fully connected layer (FC1).
4. **Minor Variation Among T2-T10:** While T2-T10 are all high, there is minor, consistent variation in the early-to-mid convolutional layers (Conv1 to Conv18). In these layers, T2 (orange) is often the lowest among this group, followed by T3 (green), with T4-T10 being the highest and most uniform.
### Interpretation
This chart likely visualizes the results of a neural network pruning or compression experiment. The "Used Weights [%]" metric suggests the proportion of weights in each layer that remain active or non-zero after some form of optimization or sparsification process.
* **T1 Represents a High-Sparsity Method:** The data strongly indicates that the method or configuration labeled "T1" induces significantly higher sparsity (lower percentage of used weights) across the entire network compared to methods T2 through T10. This could be a more aggressive pruning algorithm, a different regularization technique, or a model trained with a stricter sparsity constraint.
* **T2-T10 Represent Low-Sparsity or Baseline Methods:** The near-100% usage for T2-T10 suggests these are either baseline, unpruned models or methods that result in very little sparsity. The minor differences between them (e.g., T2 being slightly lower than T4) might reflect subtle variations in training or minor pruning effects.
* **Layer Sensitivity:** The dip in T1's usage around Conv8 suggests that the middle convolutional layers are particularly susceptible to the sparsification method applied to T1, or that these layers contain more redundancy that the method can exploit. The high usage in the fully connected layers (FC0, FC1) for all series is notable, as these layers often contain the majority of a network's parameters; the fact that even T1 retains ~55-60% here indicates that complete pruning of these layers was not achieved or desired.
* **Practical Implication:** If the goal is model compression, T1 achieves a much higher degree of parameter reduction. The critical follow-up question, not shown in this chart, would be how this dramatic reduction in used weights impacts the model's accuracy or performance on a given task. The chart sets up a clear comparison: T1 offers high sparsity, while T2-T10 maintain near-dense connectivity.
DECODING INTELLIGENCE...