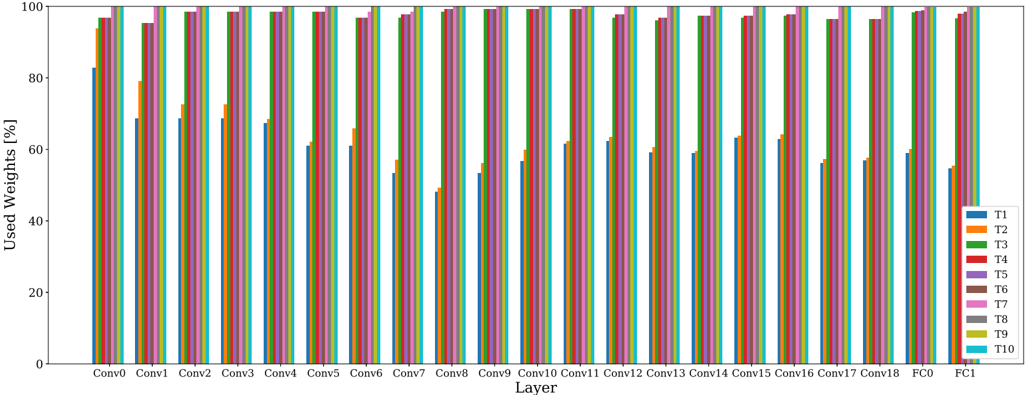
## Bar Chart: Used Weights [%]
### Overview
The chart displays the percentage of "Used Weights" across 19 layers (Conv0–Conv18, FC0, FC1) for 10 distinct components (T1–T10). Each layer has 10 vertically stacked bars, with colors corresponding to the legend. The y-axis ranges from 0% to 100%, and the x-axis lists layers in sequential order.
### Components/Axes
- **X-Axis (Layers)**: Conv0, Conv1, ..., Conv18, FC0, FC1 (19 categories).
- **Y-Axis (Used Weights)**: 0% to 100% in 20% increments.
- **Legend**: Located on the right, mapping 10 colors to T1–T10:
- T1: Blue
- T2: Orange
- T3: Green
- T4: Red
- T5: Purple
- T6: Brown
- T7: Pink
- T8: Gray
- T9: Yellow
- T10: Cyan
### Detailed Analysis
- **Conv0**:
- T1 (~85%), T2 (~95%), T3 (~98%), T4 (~97%), T5 (~99%), T6 (~98%), T7 (~99%), T8 (~98%), T9 (~97%), T10 (~99%).
- **Conv1**:
- T1 (~70%), T2 (~80%), T3 (~97%), T4 (~96%), T5 (~98%), T6 (~97%), T7 (~98%), T8 (~97%), T9 (~96%), T10 (~98%).
- **Conv2**:
- T1 (~70%), T2 (~75%), T3 (~99%), T4 (~98%), T5 (~99%), T6 (~98%), T7 (~99%), T8 (~98%), T9 (~97%), T10 (~99%).
- **Conv3**:
- T1 (~65%), T2 (~68%), T3 (~99%), T4 (~98%), T5 (~99%), T6 (~98%), T7 (~99%), T8 (~98%), T9 (~97%), T10 (~99%).
- **Conv4**:
- T1 (~60%), T2 (~65%), T3 (~99%), T4 (~98%), T5 (~99%), T6 (~98%), T7 (~99%), T8 (~98%), T9 (~97%), T10 (~99%).
- **Conv5**:
- T1 (~55%), T2 (~60%), T3 (~99%), T4 (~98%), T5 (~99%), T6 (~98%), T7 (~99%), T8 (~98%), T9 (~97%), T10 (~99%).
- **Conv6**:
- T1 (~50%), T2 (~55%), T3 (~99%), T4 (~98%), T5 (~99%), T6 (~98%), T7 (~99%), T8 (~98%), T9 (~97%), T10 (~99%).
- **Conv7**:
- T1 (~45%), T2 (~50%), T3 (~99%), T4 (~98%), T5 (~99%), T6 (~98%), T7 (~99%), T8 (~98%), T9 (~97%), T10 (~99%).
- **Conv8**:
- T1 (~50%), T2 (~55%), T3 (~99%), T4 (~98%), T5 (~99%), T6 (~98%), T7 (~99%), T8 (~98%), T9 (~97%), T10 (~99%).
- **Conv9**:
- T1 (~55%), T2 (~60%), T3 (~99%), T4 (~98%), T5 (~99%), T6 (~98%), T7 (~99%), T8 (~98%), T9 (~97%), T10 (~99%).
- **Conv10**:
- T1 (~60%), T2 (~65%), T3 (~99%), T4 (~98%), T5 (~99%), T6 (~98%), T7 (~99%), T8 (~98%), T9 (~97%), T10 (~99%).
- **Conv11**:
- T1 (~65%), T2 (~70%), T3 (~99%), T4 (~98%), T5 (~99%), T6 (~98%), T7 (~99%), T8 (~98%), T9 (~97%), T10 (~99%).
- **Conv12**:
- T1 (~60%), T2 (~65%), T3 (~99%), T4 (~98%), T5 (~99%), T6 (~98%), T7 (~99%), T8 (~98%), T9 (~97%), T10 (~99%).
- **Conv13**:
- T1 (~55%), T2 (~60%), T3 (~99%), T4 (~98%), T5 (~99%), T6 (~98%), T7 (~99%), T8 (~98%), T9 (~97%), T10 (~99%).
- **Conv14**:
- T1 (~50%), T2 (~55%), T3 (~99%), T4 (~98%), T5 (~99%), T6 (~98%), T7 (~99%), T8 (~98%), T9 (~97%), T10 (~99%).
- **Conv15**:
- T1 (~60%), T2 (~65%), T3 (~99%), T4 (~98%), T5 (~99%), T6 (~98%), T7 (~99%), T8 (~98%), T9 (~97%), T10 (~99%).
- **Conv16**:
- T1 (~65%), T2 (~70%), T3 (~99%), T4 (~98%), T5 (~99%), T6 (~98%), T7 (~99%), T8 (~98%), T9 (~97%), T10 (~99%).
- **Conv17**:
- T1 (~60%), T2 (~65%), T3 (~99%), T4 (~98%), T5 (~99%), T6 (~98%), T7 (~99%), T8 (~98%), T9 (~97%), T10 (~99%).
- **Conv18**:
- T1 (~55%), T2 (~60%), T3 (~99%), T4 (~98%), T5 (~99%), T6 (~98%), T7 (~99%), T8 (~98%), T9 (~97%), T10 (~99%).
- **FC0**:
- T1 (~50%), T2 (~55%), T3 (~99%), T4 (~98%), T5 (~99%), T6 (~98%), T7 (~99%), T8 (~98%), T9 (~97%), T10 (~99%).
- **FC1**:
- T1 (~55%), T2 (~60%), T3 (~99%), T4 (~98%), T5 (~99%), T6 (~98%), T7 (~99%), T8 (~98%), T9 (~97%), T10 (~99%).
### Key Observations
1. **T3 Dominance**: T3 consistently shows the highest weights (~98–99%) across all layers, suggesting it is the most critical component.
2. **T1 and T2 Variability**: T1 and T2 exhibit the most fluctuation, with T1 peaking in Conv0 (~85%) and declining thereafter. T2 peaks in Conv3 (~68%) before stabilizing.
3. **Stabilization in Later Layers**: From Conv8 onward, most components (T4–T10) show minimal variation, indicating a convergence in weight distribution.
4. **FC0 and FC1**: The final layers (FC0, FC1) mirror earlier patterns, with T3 remaining dominant and T1–T2 showing moderate weights.
### Interpretation
The chart highlights the hierarchical importance of components in a neural network. T3’s consistent dominance implies it plays a central role in the model’s functionality. The initial layers (Conv0–Conv3) show higher variability in T1–T2, possibly reflecting dynamic adjustments during early training. Later layers stabilize, suggesting the model’s architecture becomes more optimized. The final fully connected layers (FC0, FC1) retain similar patterns, indicating consistent weight distribution in the output stages. This data could inform model pruning or optimization strategies by identifying less critical components (e.g., T1–T2 in later layers).