## 3D Scatter Plot: Token Position vs. PCA Directions
### Overview
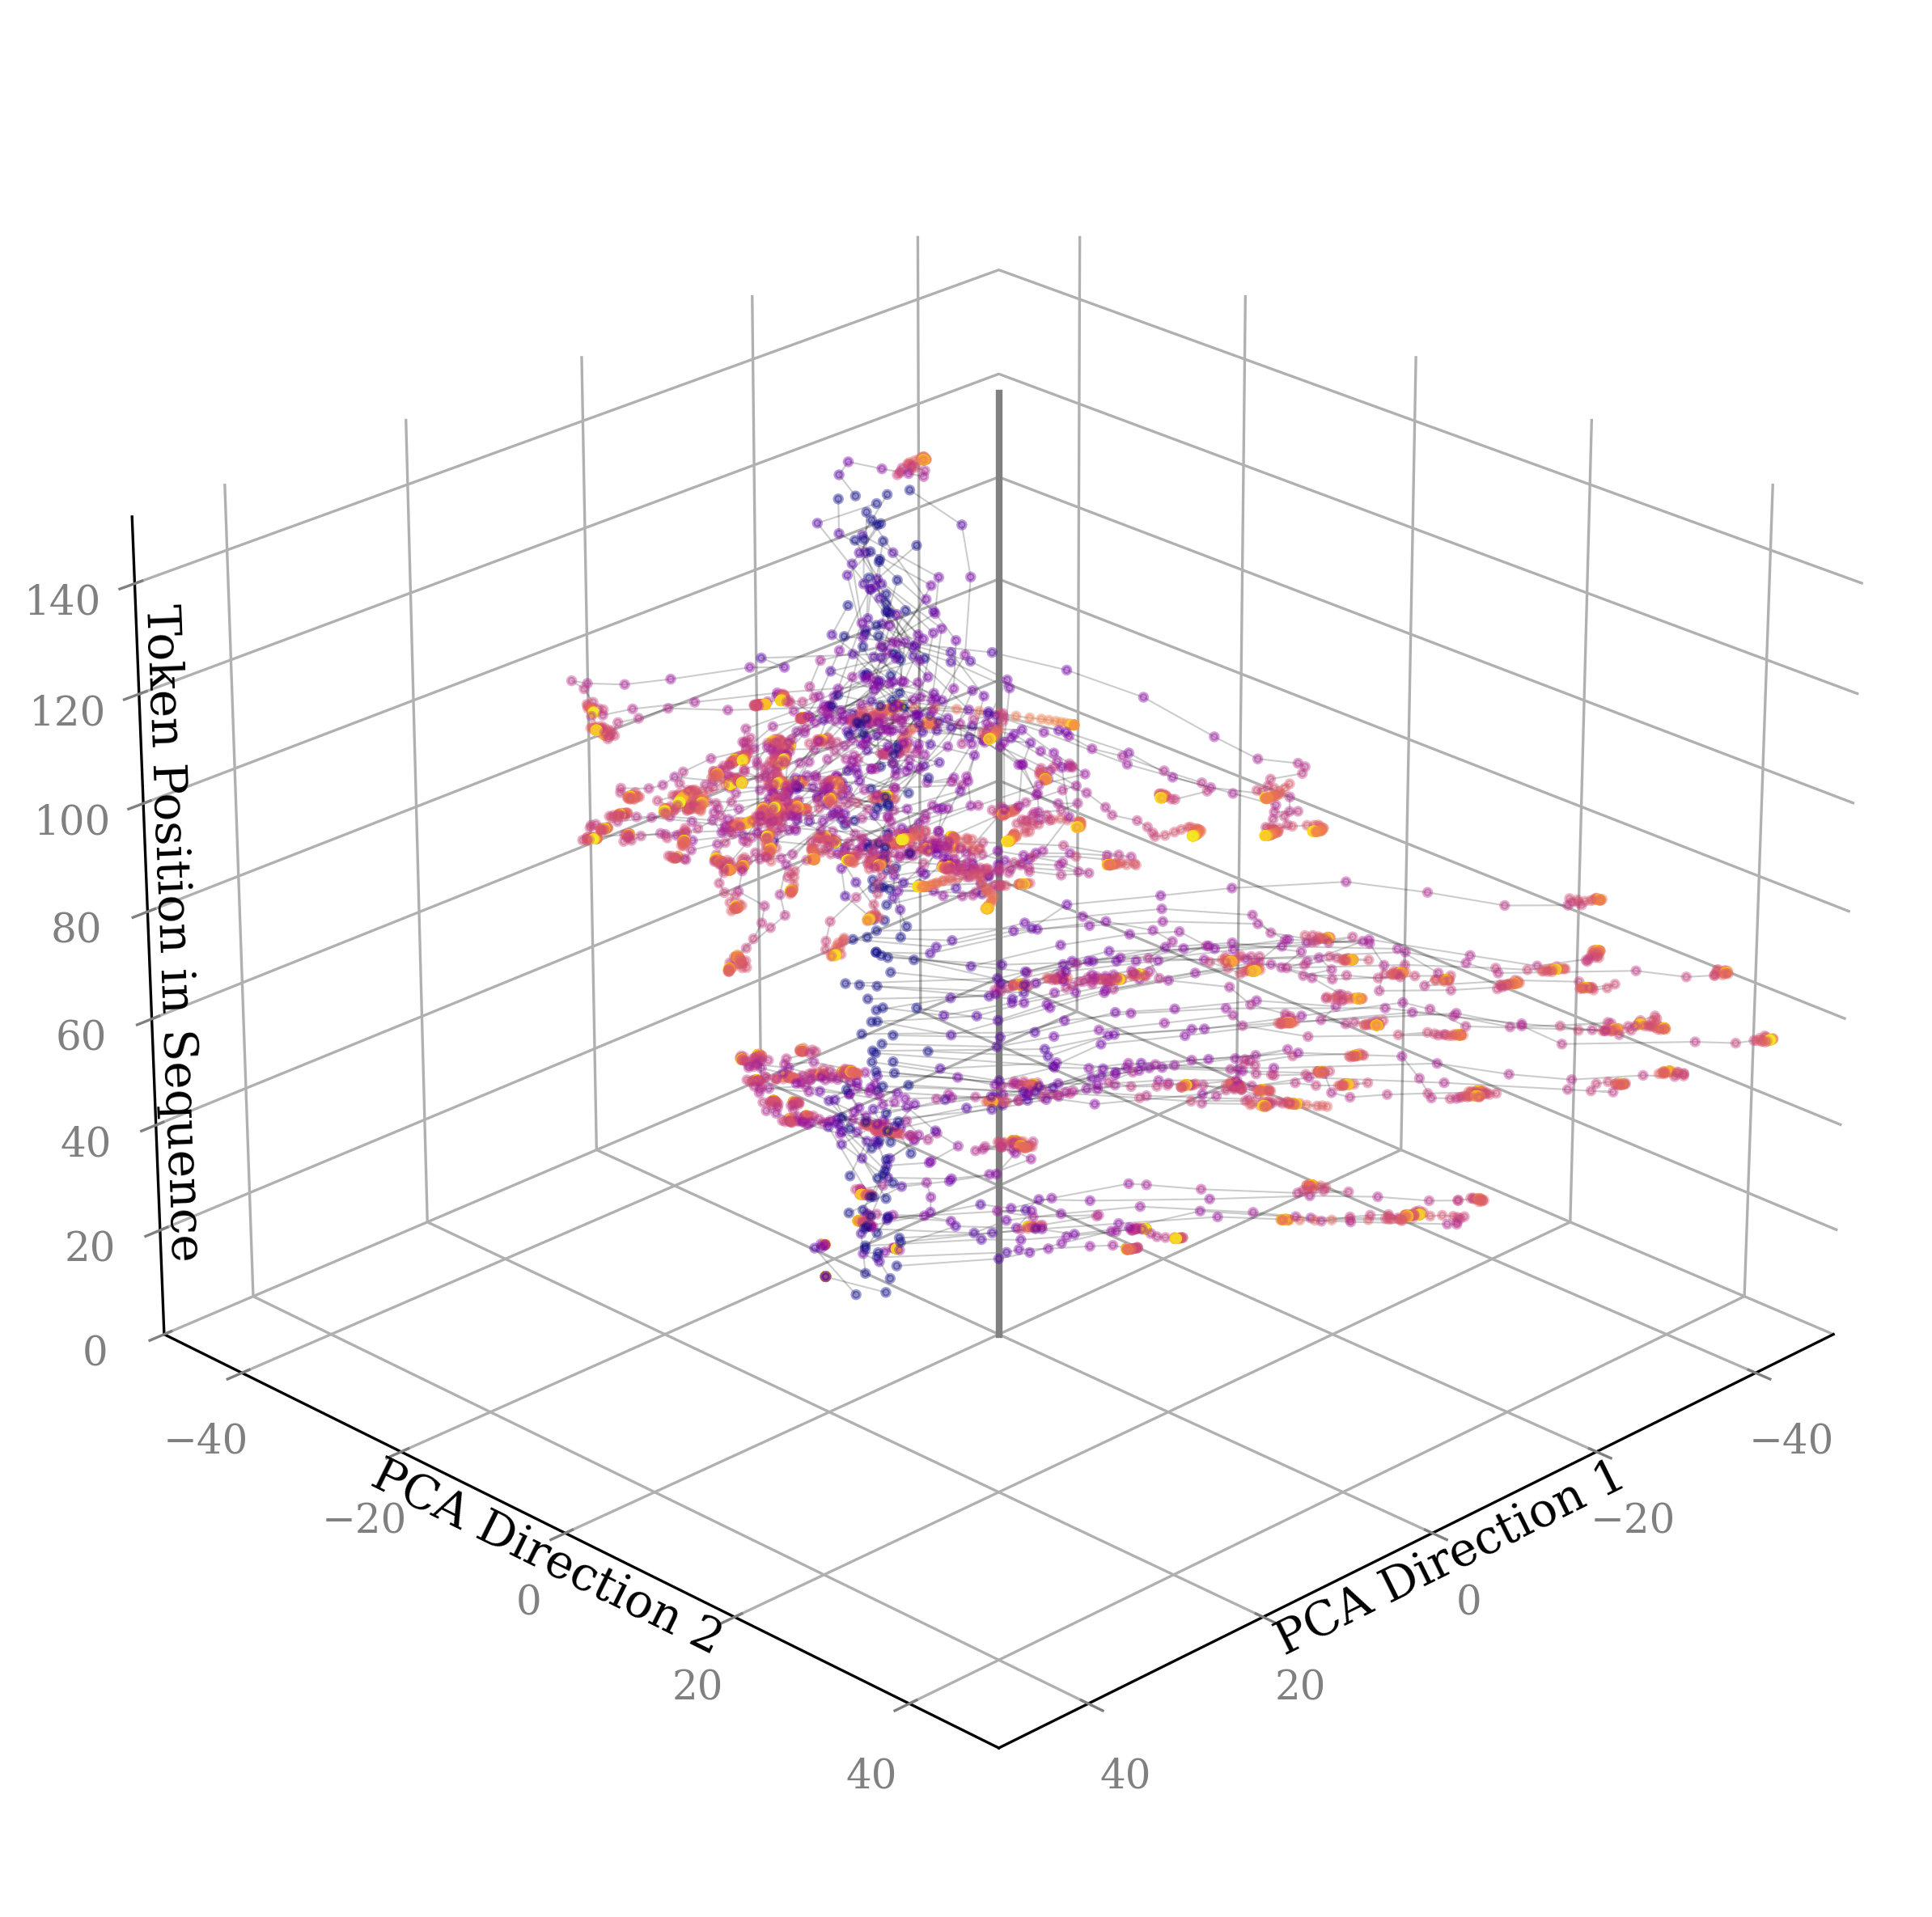
The image is a 3D scatter plot visualizing the relationship between token position in a sequence and two PCA (Principal Component Analysis) directions. Each point represents a token, and the color of the point likely indicates some other property of the token, transitioning from blue to orange. The points are connected by gray lines, showing the sequence of tokens.
### Components/Axes
* **X-axis:** PCA Direction 1, ranging from approximately -40 to 40.
* **Y-axis:** PCA Direction 2, ranging from approximately -40 to 40.
* **Z-axis:** Token Position in Sequence, ranging from 0 to 140.
* **Data Points:** Colored circles, transitioning from blue to orange.
* **Connecting Lines:** Gray lines connecting the data points, indicating sequence.
### Detailed Analysis
The data points are distributed throughout the 3D space, with a higher concentration in the middle range of the "Token Position in Sequence" axis (around 60-100).
* **PCA Direction 1:** The data points are relatively evenly distributed between -40 and 40.
* **PCA Direction 2:** Similar to PCA Direction 1, the data points are relatively evenly distributed between -40 and 40.
* **Token Position in Sequence:**
* A cluster of points exists at lower token positions (0-40), primarily blue.
* A denser cluster is present between token positions 60 and 120, with a mix of colors.
* Fewer points are observed at higher token positions (120-140), primarily purple/pink.
The color gradient from blue to orange appears to correlate with the position of the token in the sequence, with blue points tending to be at the beginning and orange points appearing later in the sequence.
### Key Observations
* The token positions are not uniformly distributed; there's a concentration in the middle.
* The PCA directions seem to have a relatively even distribution of tokens.
* The color gradient suggests a relationship between token position and some other variable represented by the color.
### Interpretation
The plot visualizes how tokens are distributed in a 3D space defined by their position in a sequence and their projections onto the first two principal components. The clustering of tokens in certain regions of the PCA space might indicate patterns or relationships within the sequence. The color gradient adds another layer of information, potentially representing the frequency, importance, or some other characteristic of the tokens. The connections between the points show the flow of the sequence through this 3D space.