\n
## 3D Scatter Plot: PCA Visualization of Token Embeddings
### Overview
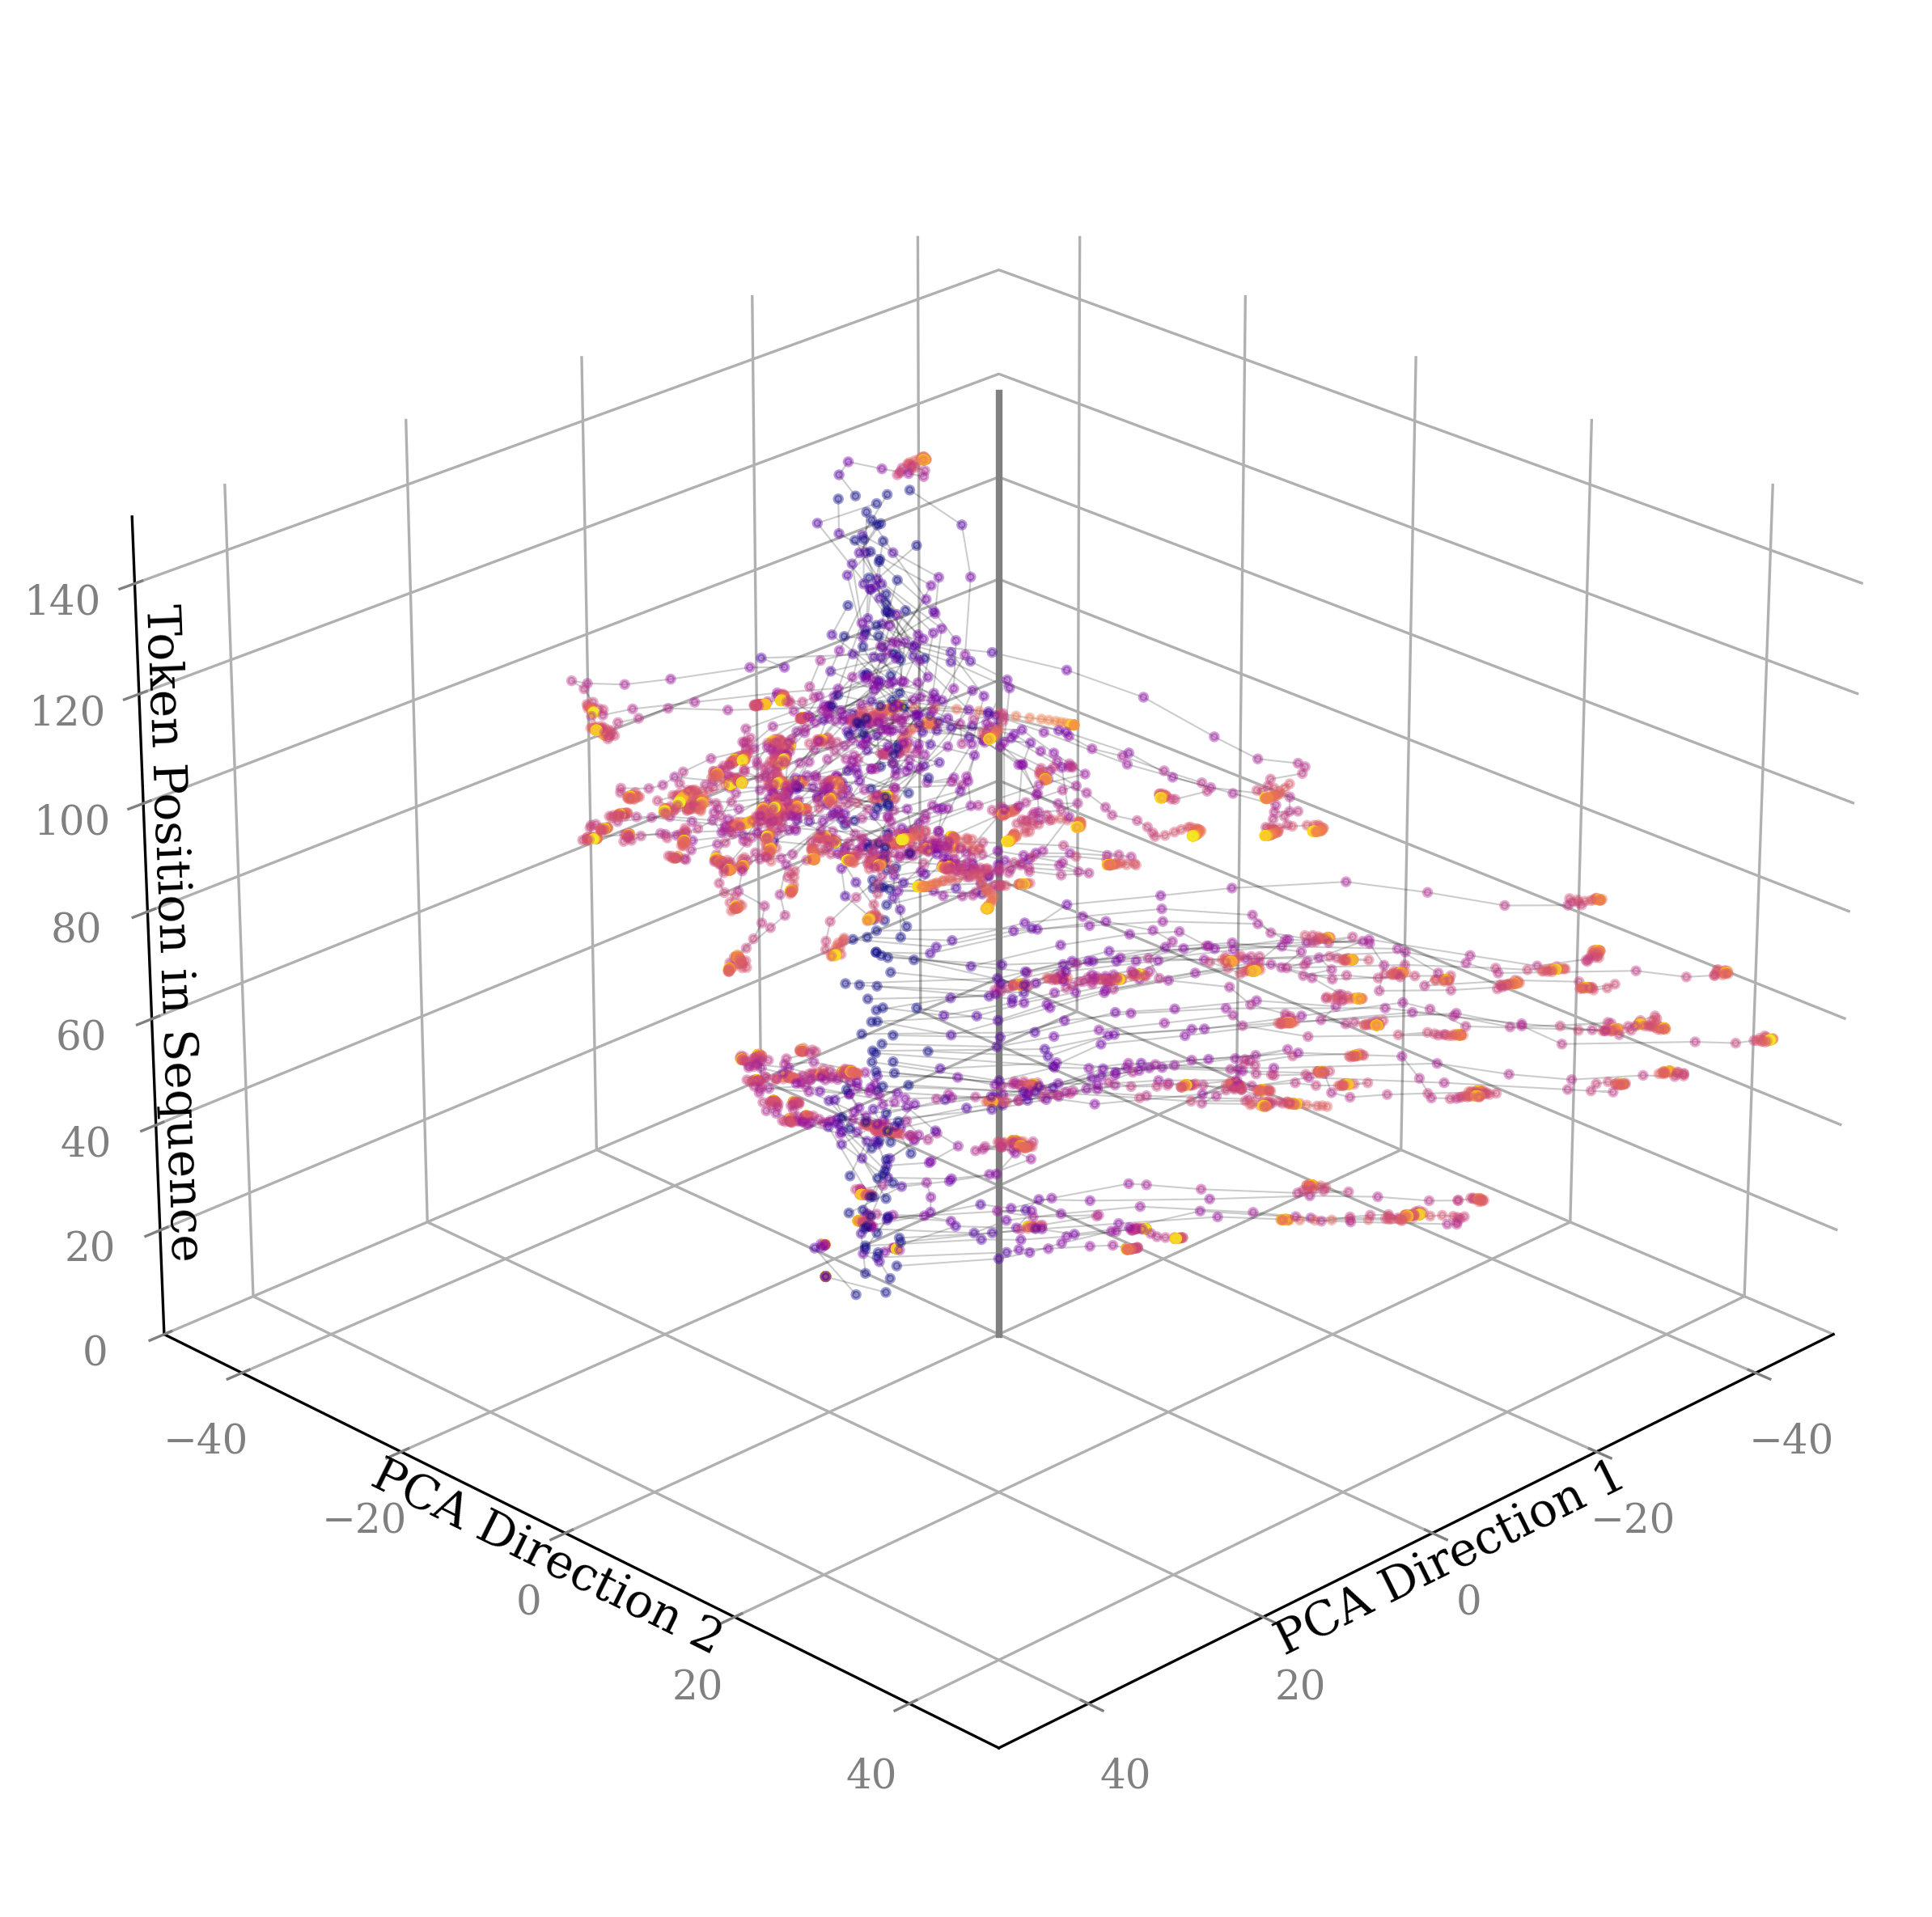
The image presents a 3D scatter plot visualizing token embeddings using Principal Component Analysis (PCA). The plot displays the distribution of tokens across two principal components (PCA Direction 1 and PCA Direction 2) and their position within a sequence (Token Position in Sequence). The points are color-coded, likely representing different token types or clusters.
### Components/Axes
* **X-axis:** PCA Direction 2, ranging from approximately -40 to 40.
* **Y-axis:** PCA Direction 1, ranging from approximately -40 to 40.
* **Z-axis:** Token Position in Sequence, ranging from approximately 0 to 140.
* **Data Points:** Colored points representing individual tokens in the sequence. The colors appear to be shades of red and purple.
* **No Legend:** There is no explicit legend provided in the image.
### Detailed Analysis
The plot shows a complex distribution of points in 3D space. The data appears to be clustered, with a general trend of increasing Token Position in Sequence as PCA Direction 1 increases.
* **Red Cluster:** A large cluster of red points is visible, concentrated around PCA Direction 1 values between 0 and 30, and PCA Direction 2 values between -20 and 20. These points span the entire range of Token Position in Sequence (0-140), but are more densely populated between 40 and 100.
* **Purple Cluster:** A second cluster of purple points is present, generally located at lower PCA Direction 1 values (between -30 and 10) and PCA Direction 2 values between -10 and 30. These points are more concentrated at lower Token Position in Sequence values (0-60).
* **Scattered Points:** There are scattered points throughout the space, particularly at higher PCA Direction 1 values (above 30) and PCA Direction 2 values (above 20). These points appear to be a mix of red and purple.
* **Trend:** The red cluster exhibits a positive correlation between PCA Direction 1 and Token Position in Sequence. As the value on PCA Direction 1 increases, the Token Position in Sequence tends to increase as well. The purple cluster shows a less pronounced trend.
### Key Observations
* The data is not uniformly distributed. There are distinct clusters of points, suggesting that the tokens can be grouped based on their PCA projections.
* The red cluster is more prominent and spans a wider range of Token Position in Sequence values than the purple cluster.
* The absence of a legend makes it difficult to interpret the meaning of the colors.
### Interpretation
This visualization likely represents the embedding space of tokens from a sequence, reduced to two dimensions using PCA. The different colors may represent different types of tokens (e.g., nouns, verbs, adjectives) or clusters identified through some other method. The plot suggests that the tokens are not randomly distributed in the embedding space, but rather exhibit some structure related to their position in the sequence and their semantic properties.
The positive correlation between PCA Direction 1 and Token Position in Sequence for the red cluster could indicate that tokens with higher values on this principal component tend to appear later in the sequence. This might be related to the grammatical structure of the sequence or the evolution of the topic over time.
The lack of a legend is a significant limitation, as it prevents a definitive interpretation of the color coding. Further analysis would require knowing what the colors represent. The plot is useful for visually identifying patterns and clusters in the embedding space, but it cannot provide a complete understanding of the data without additional information.