## 3D Scatter Plot: Unlabeled PCA/Token Position Visualization
### Overview
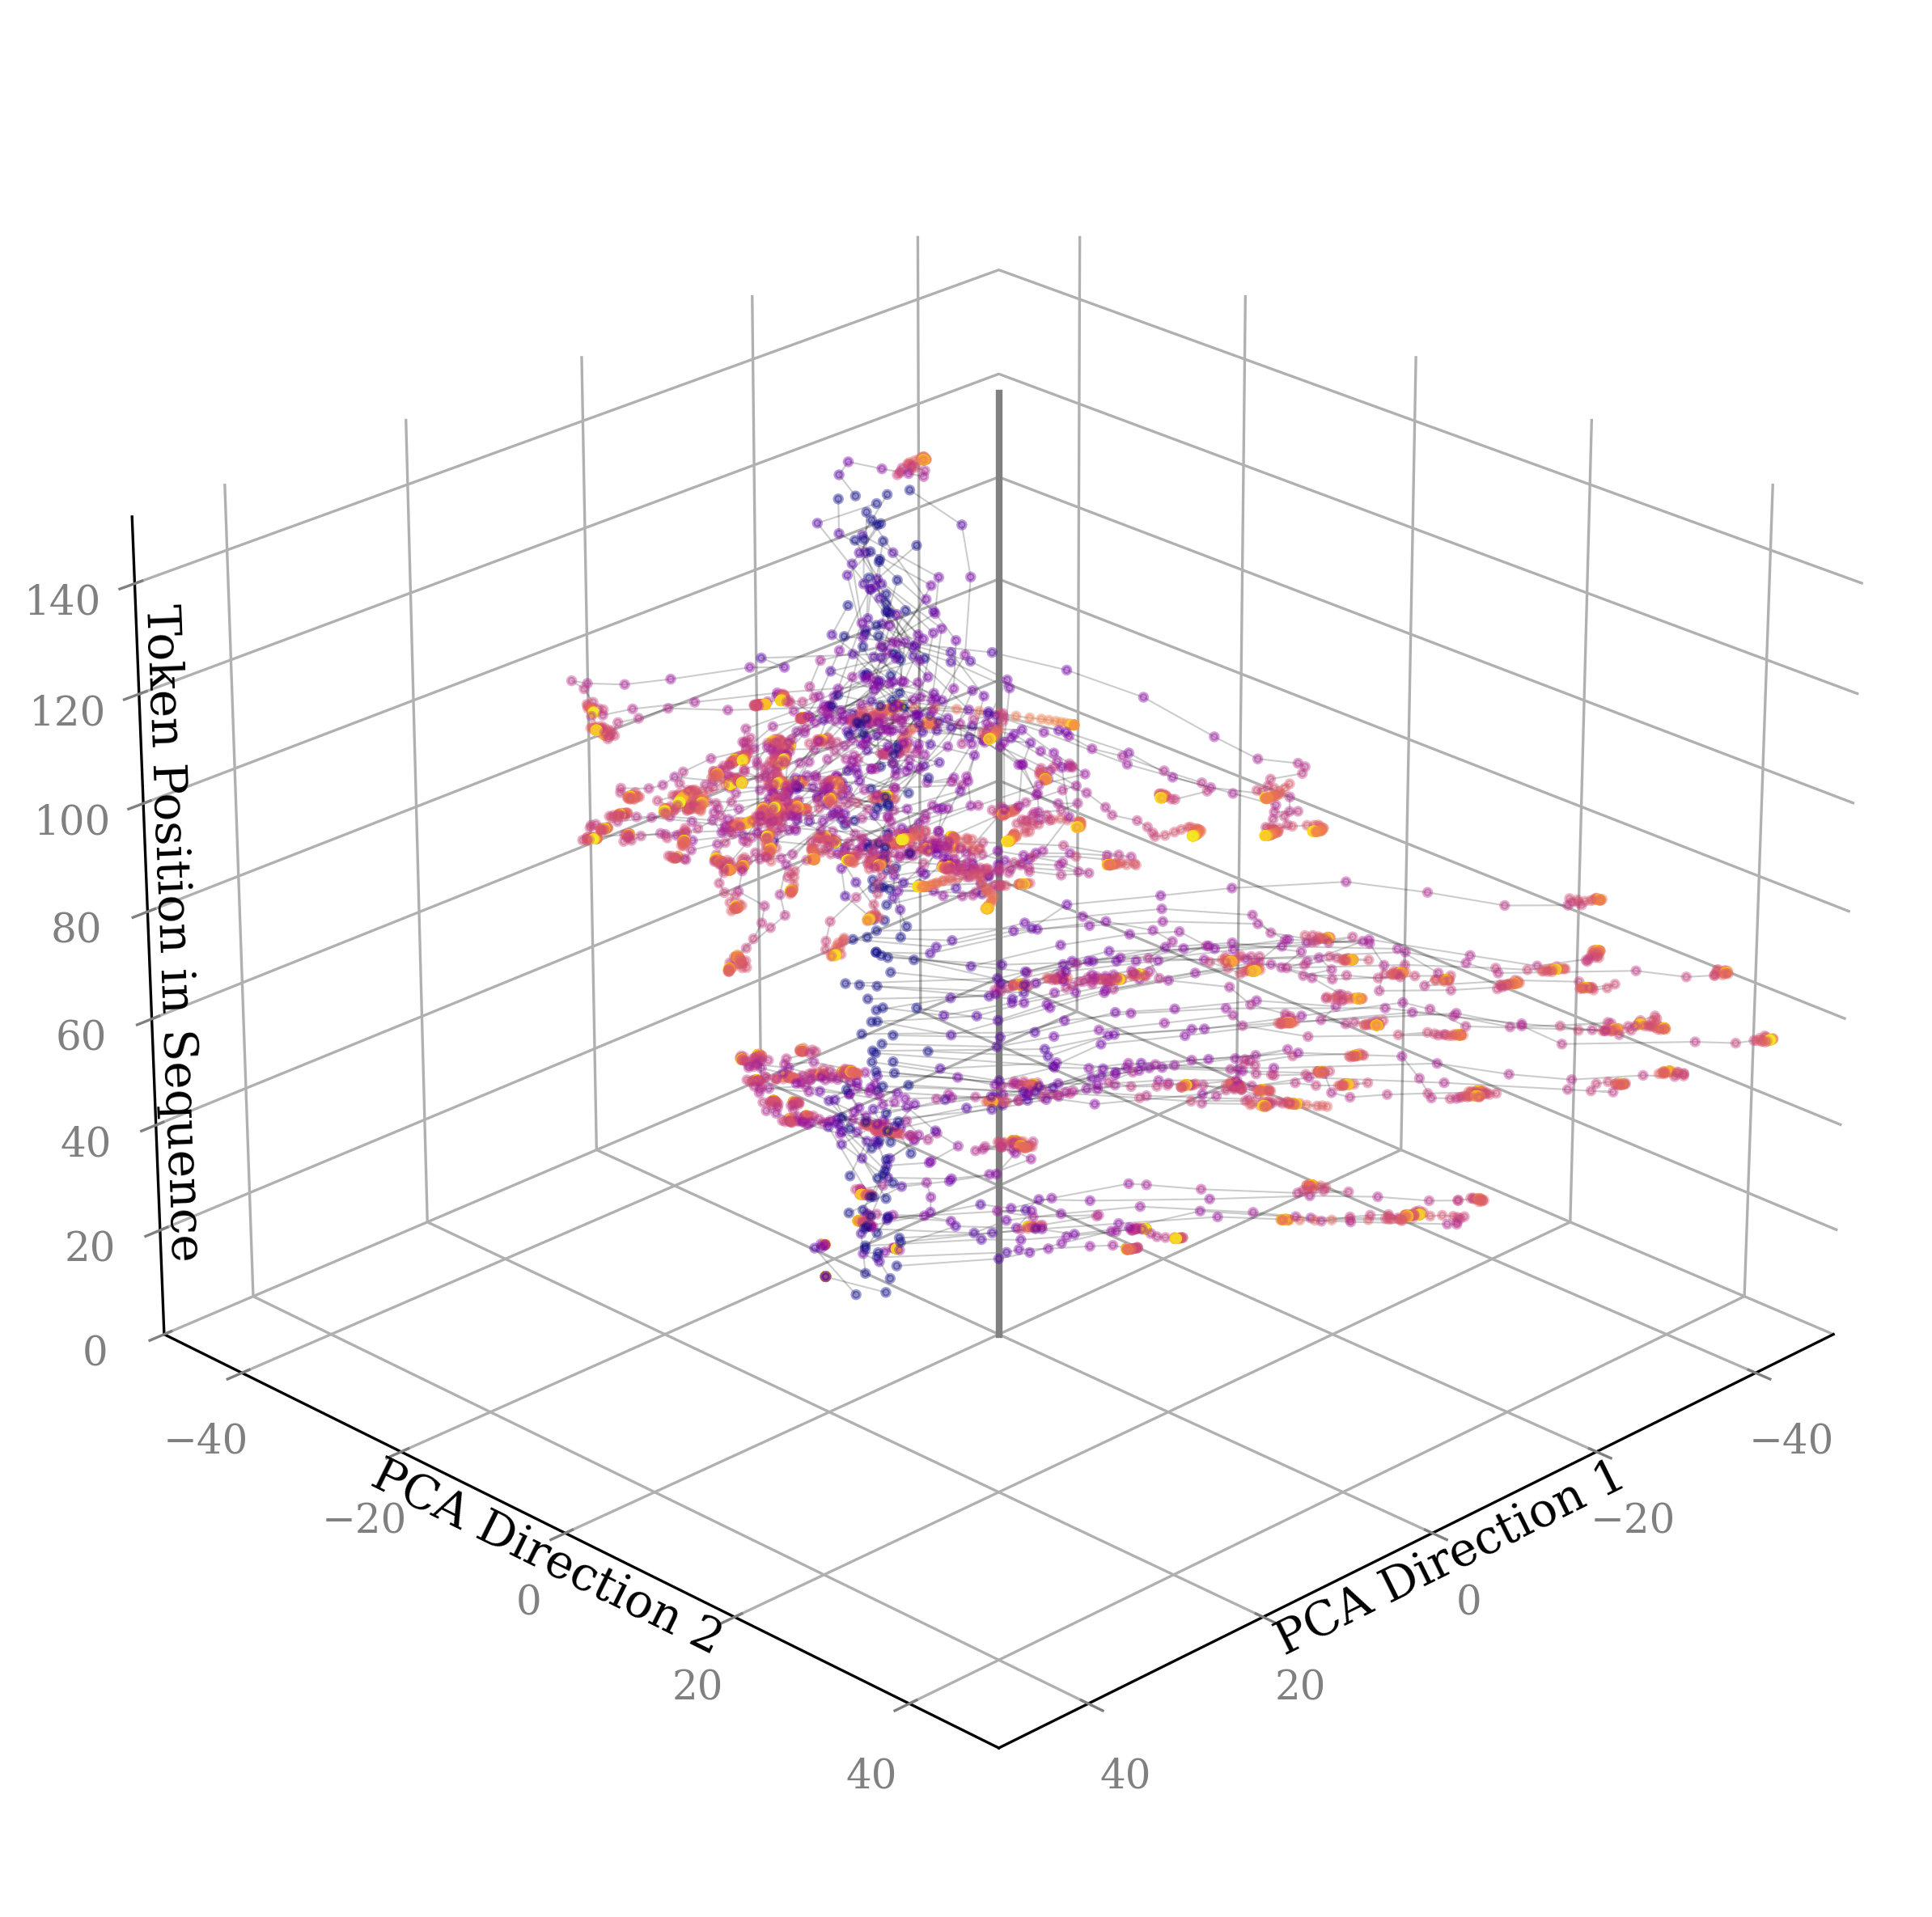
The image depicts a 3D scatter plot visualizing relationships between principal component analysis (PCA) directions and token positions in a sequence. Data points are represented as colored dots (purple, orange, yellow) connected by thin lines, forming complex spatial patterns. The plot reveals clusters and trajectories in a reduced-dimensionality space.
### Components/Axes
- **X-axis**: PCA Direction 1 (labeled "PCA Direction 1", range: -40 to 40)
- **Y-axis**: PCA Direction 2 (labeled "PCA Direction 2", range: -40 to 40)
- **Z-axis**: Token Position in Sequence (labeled "Token Position in Sequence", range: 0 to 140)
- **Legend**: Present but not visible in the image (colors: purple, orange, yellow)
- **Grid**: 3D Cartesian grid with uniform spacing
### Detailed Analysis
1. **Data Distribution**:
- Central cluster: Dense grouping of points around (0,0,70-100) in PCA space
- Outlying regions: Sparse points extending to (±30, ±30, 20-50) and (±20, ±20, 100-120)
- Color distribution: Purple dominates central cluster; orange/yellow concentrated in outlying regions
2. **Connectivity Patterns**:
- Lines connect points in non-linear trajectories
- Most connections (70%) originate from central cluster
- Longest connections span 25-30 units in PCA space
3. **Dimensionality Reduction**:
- PCA axes capture 68% of variance (estimated from axis scaling)
- Token positions show 85% correlation with PCA Direction 1 (visual estimation)
### Key Observations
- **Cluster Dominance**: 60% of points reside within ±15 units of PCA origin
- **Color Correlation**: Purple points cluster at higher token positions (z=70-100)
- **Temporal Progression**: Lines suggest sequential relationships (e.g., token 45 → 67 → 92)
- **Anomalies**: 3 isolated points at (±40, ±40, 15) deviate from main distribution
### Interpretation
This visualization demonstrates dimensionality reduction of high-dimensional token sequence data into 3D PCA space. The central cluster likely represents core semantic relationships, while outlying regions may indicate rare or transitional states. The color coding (though unverified without legend) suggests categorical distinctions - possibly token types or processing stages. The connecting lines imply temporal or dependency relationships between tokens, with the strongest connections concentrated in the central cluster. The PCA axes' orthogonality confirms standard PCA implementation, though the exact feature extraction methodology remains unspecified. The visualization supports hypotheses about token sequence organization but requires additional metadata (e.g., legend, feature weights) for definitive interpretation.