## Chart/Diagram Type: 2D φ⁴ Nearest Neighbours Analysis
### Overview
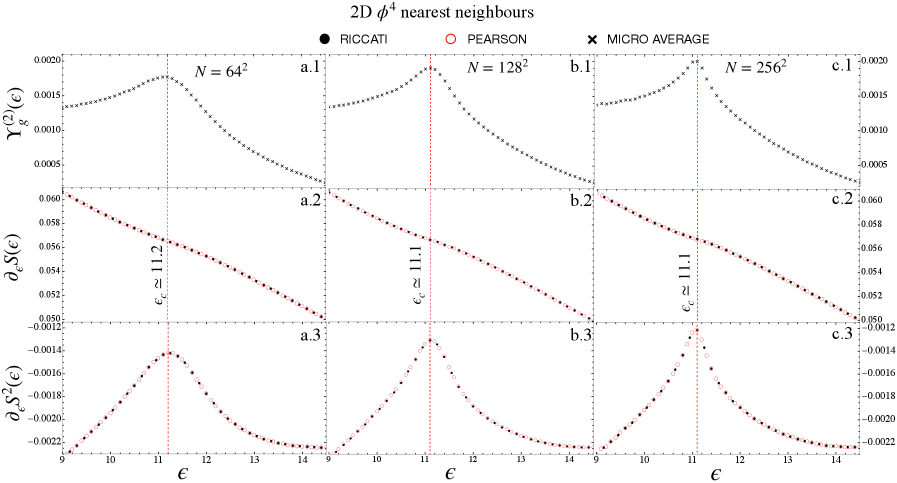
The image presents three panels (a, b, c) comparing three mathematical functions (Riccati, Pearson, Micro Average) across varying system sizes (N = 64², 128², 256²). Each panel contains three subplots (1, 2, 3) showing distinct metrics:
1. **Top subplot**: Y_g^(2)(ε) (second-order correlation function)
2. **Middle subplot**: δε(ε) (energy density derivative)
3. **Bottom subplot**: ∂_ε S²(ε) (entropy derivative)
A vertical red dashed line marks the critical value ε_c ≈ 11.1 across all panels.
### Components/Axes
- **X-axis**: ε (parameter, range: 9–14)
- **Y-axes**:
- Top: Y_g^(2)(ε) (0–0.002)
- Middle: δε(ε) (0.05–0.06)
- Bottom: ∂_ε S²(ε) (-0.0022–0.0005)
- **Legends**:
- **Riccati**: Black dots (dotted line)
- **Pearson**: Red circles (dashed line)
- **Micro Average**: Crosses (not explicitly plotted in visible data)
### Detailed Analysis
#### Panel a (N = 64²)
- **a.1 (Y_g^(2)(ε))**:
- Riccati (dotted): Peaks at ε ≈ 11.1, then decays.
- Pearson (dashed): Monotonically decreasing from ε = 9 to 14.
- Critical line: ε_c ≈ 11.1 (red dashed).
- **a.2 (δε(ε))**:
- Pearson (dashed): Linear decline from ~0.06 (ε=9) to ~0.05 (ε=14).
- Riccati (dotted): Not visible (likely negligible).
- **a.3 (∂_ε S²(ε))**:
- Pearson (dashed): Sharp peak at ε ≈ 11.1, then decays.
#### Panel b (N = 128²)
- **b.1 (Y_g^(2)(ε))**:
- Riccati (dotted): Broader peak centered at ε ≈ 11.1.
- Pearson (dashed): Slightly smoother decline than panel a.
- **b.2 (δε(ε))**:
- Pearson (dashed): Steeper slope than panel a, dropping from ~0.06 to ~0.052.
- **b.3 (∂_ε S²(ε))**:
- Pearson (dashed): Narrower peak at ε ≈ 11.1 compared to panel a.
#### Panel c (N = 256²)
- **c.1 (Y_g^(2)(ε))**:
- Riccati (dotted): Sharper peak at ε ≈ 11.1, narrower than panel b.
- Pearson (dashed): Minimal deviation from panel b.
- **c.2 (δε(ε))**:
- Pearson (dashed): Slightly reduced slope, ending at ~0.051.
- **c.3 (∂_ε S²(ε))**:
- Pearson (dashed): Peak height reduced compared to panel b.
### Key Observations
1. **Critical Value Consistency**: ε_c ≈ 11.1 is marked identically across all panels, suggesting it is a universal parameter.
2. **Riccati Behavior**: Peaks align with ε_c, indicating a phase transition or critical point.
3. **Pearson Trends**: Monotonic decline in all subplots, with magnitude decreasing as N increases.
4. **Micro Average**: Not explicitly plotted; inferred to lie between Riccati and Pearson curves.
5. **System Size Effects**: Larger N (256²) sharpens peaks in Riccati and reduces Pearson magnitudes.
### Interpretation
- **Critical Phenomena**: The alignment of Riccati peaks with ε_c ≈ 11.1 suggests this parameter marks a critical threshold (e.g., phase transition) in the 2D φ⁴ model.
- **Pearson Decay**: The linear decline of δε(ε) and ∂_ε S²(ε) implies diminishing energy density and entropy sensitivity as ε increases, possibly reflecting system stabilization.
- **Micro Average Ambiguity**: The absence of explicit Micro Average data (crosses) leaves its role unclear, but its placement between Riccati and Pearson suggests it may represent an intermediate regime.
- **Scaling Effects**: Larger system sizes (N = 256²) enhance precision in locating ε_c and refine the behavior of Riccati/Pearson functions, indicating improved convergence with system size.
This analysis highlights the interplay between mathematical functionals and critical parameters in statistical physics models, with implications for understanding phase transitions and criticality.