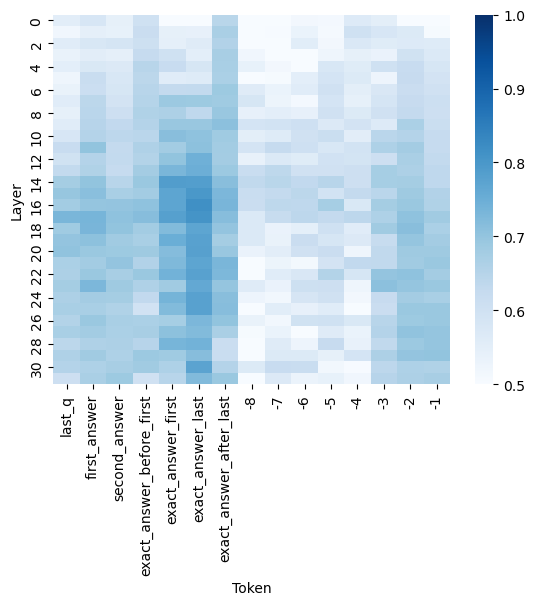
## Heatmap: Layer vs. Token
### Overview
The image is a heatmap displaying the relationship between "Layer" (y-axis) and "Token" (x-axis). The color intensity represents a value, with darker blue indicating higher values and lighter blue indicating lower values. The heatmap provides a visual representation of how different tokens are represented across different layers.
### Components/Axes
* **X-axis (Token):**
* Categories: last\_q, first\_answer, second\_answer, exact\_answer\_before\_first, exact\_answer\_first, exact\_answer\_last, exact\_answer\_after\_last, -8, -7, -6, -5, -4, -3, -2, -1
* **Y-axis (Layer):**
* Scale: 0 to 30, incrementing by 2 (0, 2, 4, 6, 8, 10, 12, 14, 16, 18, 20, 22, 24, 26, 28, 30)
* **Color Scale (Right side of the heatmap):**
* 1. 0 (Darkest Blue)
* 0.9
* 0.8
* 0.7
* 0.6
* 0.5 (Lightest Blue)
### Detailed Analysis
The heatmap shows varying intensities of blue, indicating different values for each layer-token combination.
* **last\_q:** The values are relatively high (darker blue) from layer 0 to layer 30, with some variation.
* **first\_answer:** The values are relatively high (darker blue) from layer 0 to layer 30, with some variation.
* **second\_answer:** The values are relatively high (darker blue) from layer 0 to layer 30, with some variation.
* **exact\_answer\_before\_first:** The values are relatively high (darker blue) from layer 0 to layer 30, with some variation. There is a notably darker blue region around layers 14-18.
* **exact\_answer\_first:** The values are relatively high (darker blue) from layer 0 to layer 30, with some variation.
* **exact\_answer\_last:** The values are relatively high (darker blue) from layer 0 to layer 30, with some variation.
* **exact\_answer\_after\_last:** The values are relatively high (darker blue) from layer 0 to layer 30, with some variation.
* **-8 to -1:** The values are generally lower (lighter blue) compared to the other tokens, with some variation across layers.
### Key Observations
* The tokens "last\_q", "first\_answer", "second\_answer", "exact\_answer\_before\_first", "exact\_answer\_first", "exact\_answer\_last", and "exact\_answer\_after\_last" generally have higher values across all layers compared to the tokens "-8" to "-1".
* There is a noticeable darker blue region for "exact\_answer\_before\_first" around layers 14-18, indicating a higher value in this specific layer range.
* The tokens "-8" to "-1" show a trend of lower values, suggesting they might be less relevant or have a different representation across the layers.
### Interpretation
The heatmap visualizes the relationship between different tokens and layers, likely in a neural network or similar model. The color intensity could represent activation strength, attention weights, or some other measure of importance. The higher values for "last\_q", "first\_answer", "second\_answer", "exact\_answer\_before\_first", "exact\_answer\_first", "exact\_answer\_last", and "exact\_answer\_after\_last" suggest that these tokens are more significant or receive more attention across all layers. The lower values for "-8" to "-1" indicate that these tokens might be less relevant or have a different role in the model. The darker blue region for "exact\_answer\_before\_first" around layers 14-18 could indicate that this token is particularly important in those specific layers.