\n
## Heatmap: Layer vs. Token Correlation
### Overview
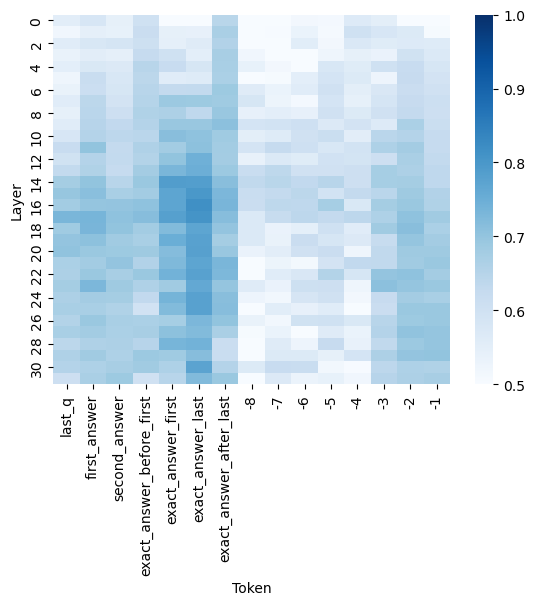
The image presents a heatmap visualizing the correlation between 'Layer' and 'Token' variables. The heatmap uses a color gradient from light blue (low correlation) to dark blue (high correlation), with values ranging from approximately 0.5 to 1.0. The heatmap appears to represent a matrix where each cell's color indicates the strength of the relationship between a specific layer and a specific token.
### Components/Axes
* **X-axis (Horizontal):** Labeled "Token". The tokens are: 'last_q', 'first_answer', 'second_answer', 'exact_answer_before_first', 'exact_answer_first', 'exact_answer_last', '-8', '-7', '-6', '-5', '-4', '-3', '-2', '-1'.
* **Y-axis (Vertical):** Labeled "Layer". The layers are numbered from 0 to 30, with each number representing a distinct layer.
* **Color Scale (Legend):** Located on the right side of the heatmap. The scale ranges from 0.5 (light blue) to 1.0 (dark blue). The scale is linear.
* **Data Cells:** Each cell represents the correlation value between a specific layer and a specific token.
### Detailed Analysis
The heatmap shows varying degrees of correlation between layers and tokens. Here's a breakdown of observed trends and approximate values:
* **'last_q' Token:** Shows consistently low correlation (around 0.5 - 0.6) across all layers.
* **'first_answer' Token:** Correlation starts low at layer 0 (approximately 0.55) and increases to a peak around layer 10-12 (approximately 0.85-0.9), then decreases again.
* **'second_answer' Token:** Similar trend to 'first_answer', with a peak correlation around layers 8-14 (approximately 0.8-0.9).
* **'exact_answer_before_first' Token:** Shows a moderate correlation (around 0.65-0.75) across most layers, with a slight increase towards the middle layers.
* **'exact_answer_first' Token:** Exhibits a strong correlation (around 0.8-0.9) across layers 6-18, with a peak around layer 10-12.
* **'exact_answer_last' Token:** Shows a moderate correlation (around 0.7-0.8) across layers 6-20.
* **'-8' to '-1' Tokens:** These tokens show a generally increasing correlation with increasing layer number, peaking around layers 16-24. The correlation values range from approximately 0.6 to 0.9. Specifically:
* '-8': Correlation increases from ~0.6 at layer 0 to ~0.85 at layer 24.
* '-7': Correlation increases from ~0.6 at layer 0 to ~0.9 at layer 20.
* '-6': Correlation increases from ~0.6 at layer 0 to ~0.9 at layer 22.
* '-5': Correlation increases from ~0.6 at layer 0 to ~0.9 at layer 24.
* '-4': Correlation increases from ~0.6 at layer 0 to ~0.9 at layer 26.
* '-3': Correlation increases from ~0.6 at layer 0 to ~0.9 at layer 28.
* '-2': Correlation increases from ~0.6 at layer 0 to ~0.9 at layer 30.
* '-1': Correlation increases from ~0.6 at layer 0 to ~0.9 at layer 30.
### Key Observations
* The 'first_answer' and 'exact_answer_first' tokens exhibit the highest correlations, particularly in the middle layers (6-18).
* The 'last_q' token consistently shows the lowest correlation across all layers.
* The negative numbered tokens show a clear positive correlation with layer number, suggesting their influence increases as the model progresses through layers.
* There is a noticeable diagonal pattern in the heatmap, indicating a relationship between layer number and token influence.
### Interpretation
This heatmap likely represents the attention weights or activation patterns within a neural network model, possibly a language model. The 'tokens' likely represent different parts of the input or output sequence, and the 'layers' represent different stages of processing within the model.
The high correlation between 'first_answer' and 'exact_answer_first' in the middle layers suggests that these tokens are strongly related during the model's reasoning process. The low correlation of 'last_q' might indicate that the initial question has less influence on the model's final answer.
The increasing correlation of the negative numbered tokens with layer number suggests that these tokens become more important as the model processes information and refines its understanding. This could indicate that these tokens represent features or concepts that are gradually learned or refined throughout the model's layers.
The heatmap provides insights into how the model attends to different parts of the input and how this attention changes across different layers. This information can be valuable for understanding the model's behavior, identifying potential biases, and improving its performance.