## Heatmap: Layer-Token Activation Intensity
### Overview
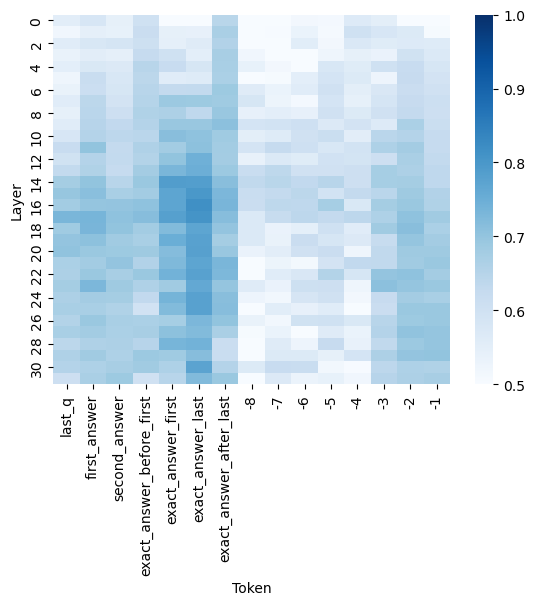
The image is a heatmap visualizing the intensity of activation or attention values across different layers and tokens in a neural network. The x-axis represents tokens (ranging from -1 to 30), and the y-axis represents layers (labeled with terms like "last_q", "first_answer", "second_answer", etc.). The color intensity corresponds to activation values, with darker blue indicating higher values (closer to 1.0) and lighter blue indicating lower values (closer to 0.5).
### Components/Axes
- **X-axis (Token)**: Labeled with integers from -1 to 30, representing token positions.
- **Y-axis (Layer)**: Labeled with terms such as:
- "last_q"
- "first_answer"
- "second_answer"
- "exact_answer_before_first"
- "exact_answer_first"
- "exact_answer_last"
- "exact_answer_after_last"
- Numerical layers 1–30 (e.g., "1", "2", ..., "30").
- **Legend**: Positioned on the right, showing a gradient from light blue (0.5) to dark blue (1.0). No explicit legend labels are present, but the colorbar implies a continuous scale.
### Detailed Analysis
- **Token Ranges**:
- **Tokens -1, 0, 1**: Lightest blue (values ~0.5–0.6), indicating low activation.
- **Tokens 2–10**: Gradual increase in intensity, peaking at ~0.7–0.8.
- **Tokens 11–17**: Moderate activation (~0.7–0.9).
- **Tokens 18–20**: Darkest blue (values ~0.9–1.0), suggesting peak activation.
- **Tokens 21–30**: Decreasing intensity, returning to ~0.6–0.7.
- **Layer Ranges**:
- **Layers 1–10**: Light to moderate blue (~0.5–0.7), with sporadic darker patches.
- **Layers 11–14**: Darkest blue (~0.9–1.0), indicating highest activation.
- **Layers 15–20**: Moderate activation (~0.7–0.9), with some variability.
- **Layers 21–30**: Light blue (~0.5–0.6), showing minimal activation.
### Key Observations
1. **Peak Activation**: The highest values (darkest blue) are concentrated in **layers 12–14** and **tokens 18–20**, suggesting these regions are critical for processing.
2. **Edge Effects**: The lowest activation values (~0.5) occur at the edges of the heatmap (layers 28–30 and tokens -1, 0, 1).
3. **Gradient Pattern**: Activation intensity increases toward the center (layers 12–14, tokens 18–20) and decreases toward the edges, forming a "peak" structure.
### Interpretation
The heatmap likely represents attention weights or activation magnitudes in a transformer-based model. The central layers (12–14) and tokens (18–20) exhibit the strongest activation, implying they play a pivotal role in encoding or decoding information. The gradual decline in activation toward the edges suggests diminishing relevance of peripheral tokens or layers. This pattern aligns with typical attention mechanisms, where central tokens (e.g., key words in a sentence) dominate processing, while peripheral tokens (e.g., punctuation or filler words) have weaker influence. The absence of extreme outliers indicates a relatively balanced distribution of activation across the model.