## Diagram: Weighted Sum of State Transitions
### Overview
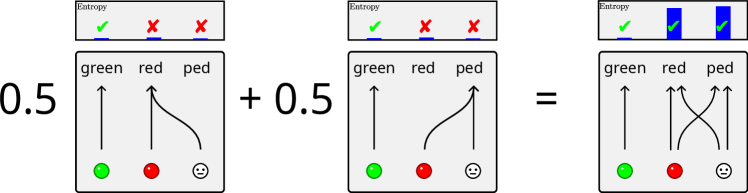
The image depicts a diagram illustrating a weighted sum of state transitions, likely in the context of a Markov process or similar probabilistic model. It shows two separate transition diagrams, each weighted by 0.5, which are then combined to produce a final transition diagram. Each individual diagram represents transitions between three states: "green," "red," and "ped" (pedestrian). The "Entropy" above each diagram indicates the uncertainty associated with each state distribution.
### Components/Axes
* **Diagram Structure:** The image is divided into three main sections, representing the two initial diagrams and their combined result. Each diagram is enclosed in a gray box.
* **States:** Each diagram represents three states: "green," "red," and "ped" (pedestrian). These states are labeled at the top of each box.
* **State Indicators:** Below each state label, there is a visual representation of the state: a green circle for "green," a red circle for "red," and a smiley face for "ped."
* **Transitions:** Transitions between states are represented by arrows. The shape and direction of the arrows indicate the probability and direction of the transition.
* **Weights:** The diagrams are weighted by "0.5" and "+ 0.5," indicating that each contributes equally to the final result.
* **Entropy Indicators:** Above each diagram, there is a small chart labeled "Entropy." This chart shows the entropy associated with each state. The entropy is represented by a blue bar, and a green checkmark or red "X" indicates whether the entropy is low or high, respectively.
### Detailed Analysis
**Left Diagram (Weighted by 0.5):**
* **Entropy:** Low entropy for "green" (checkmark), high entropy for "red" and "ped" (X marks).
* **Transitions:**
* "green" transitions directly to "green" (straight upward arrow).
* "red" transitions to "ped" (curved arrow from "red" to "ped").
**Middle Diagram (Weighted by + 0.5):**
* **Entropy:** Low entropy for "green" (checkmark), high entropy for "red" and "ped" (X marks).
* **Transitions:**
* "green" transitions directly to "green" (straight upward arrow).
* "red" transitions to "ped" (curved arrow from "red" to "ped").
**Right Diagram (Result):**
* **Entropy:** Low entropy for all three states: "green," "red," and "ped" (checkmark for each). The entropy is represented by blue bars.
* **Transitions:**
* "green" transitions directly to "green" (straight upward arrow).
* "red" transitions directly to "red" (straight upward arrow).
* "ped" transitions directly to "ped" (straight upward arrow).
* "red" transitions to "ped" (curved arrow from "red" to "ped").
* "ped" transitions to "red" (curved arrow from "ped" to "red").
### Key Observations
* The initial diagrams have high entropy for "red" and "ped," indicating uncertainty in those states.
* The final diagram has low entropy for all states, suggesting that the combination of the initial diagrams has reduced the overall uncertainty.
* The transitions in the final diagram represent a combination of the transitions in the initial diagrams.
### Interpretation
The diagram illustrates how combining multiple probabilistic models (represented by the initial diagrams) can lead to a more deterministic model (represented by the final diagram). The weighting of 0.5 for each initial diagram suggests that they are equally important in determining the final state transitions. The reduction in entropy from the initial diagrams to the final diagram indicates that the combined model is more predictable and less uncertain. The transitions in the final diagram show a complex interplay between the "red" and "ped" states, with transitions occurring in both directions. This could represent a situation where the "red" state influences the "ped" state, and vice versa.