\n
## Diagram: Entropy Combination
### Overview
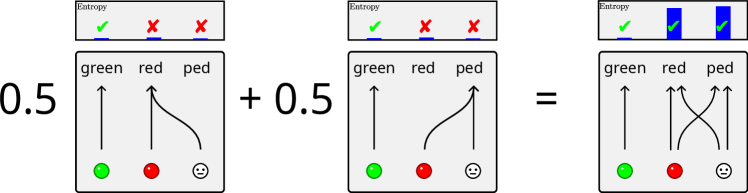
The image depicts a visual representation of entropy combination. It shows two identical diagrams, each representing a probability distribution with 'green', 'red', and 'ped' (presumably 'purple') categories, being added together to produce a combined entropy diagram. Each diagram consists of a bar chart representing the probabilities of each category, and a corresponding entropy bar above it.
### Components/Axes
The diagram consists of three main sections arranged horizontally:
1. **Left Diagram:** Represents a value of 0.5, with probabilities for 'green', 'red', and 'ped'.
2. **Middle Diagram:** Represents a value of 0.5, identical to the left diagram in terms of probabilities for 'green', 'red', and 'ped'.
3. **Right Diagram:** Represents the combination of the left and middle diagrams, showing the resulting probabilities and entropy.
Each diagram has the following components:
* **Category Labels:** "green", "red", "ped" are labeled below the bar chart.
* **Bar Chart:** Represents the probability distribution of each category. The height of the bar corresponds to the probability.
* **Entropy Bar:** A bar above the chart labeled "Entropy". It contains colored blocks representing the entropy contribution of each category.
* **Category Indicators:** Colored circles (green, red, and a smiley face) below the bar chart, likely representing the categories themselves.
* **Arrows:** Curved arrows connect the category indicators to the corresponding bars in the bar chart, indicating the probability associated with each category.
### Detailed Analysis or Content Details
**Left Diagram (0.5):**
* **green:** Probability is approximately 0.7. Arrow points upwards.
* **red:** Probability is approximately 0.2. Arrow points downwards.
* **ped:** Probability is approximately 0.1. Arrow points upwards.
* **Entropy:** The entropy bar shows a green block, a red block, and a blue block. The green block is the largest, followed by the red block, and then the blue block.
**Middle Diagram (0.5):**
* **green:** Probability is approximately 0.7. Arrow points upwards.
* **red:** Probability is approximately 0.2. Arrow points downwards.
* **ped:** Probability is approximately 0.1. Arrow points upwards.
* **Entropy:** The entropy bar shows a green block, a red block, and a blue block. The green block is the largest, followed by the red block, and then the blue block.
**Right Diagram (Combination):**
* **green:** Probability is approximately 0.7. Arrow points upwards.
* **red:** Probability is approximately 0.2. Arrow points downwards.
* **ped:** Probability is approximately 0.1. Arrow points upwards.
* **Entropy:** The entropy bar shows two green blocks, two red blocks, and two blue blocks. The green blocks are the largest, followed by the red blocks, and then the blue blocks.
### Key Observations
* The left and middle diagrams are identical.
* The combination diagram shows that the probabilities of each category remain the same after addition.
* The entropy of the combined diagram is higher than the entropy of each individual diagram, as indicated by the increased number of blocks in the entropy bar.
* The arrows indicate a relationship between the category indicators and their corresponding probabilities.
### Interpretation
The diagram illustrates the principle of entropy addition. It demonstrates that when two independent probability distributions are combined, the overall entropy increases. The probabilities of individual categories remain unchanged, but the uncertainty (entropy) associated with the combined distribution is greater. The use of colors (green, red, and blue) in the entropy bars likely represents the contribution of each category to the overall entropy. The diagram suggests that entropy is an additive property, and that combining independent sources of information increases the overall uncertainty. The smiley face is likely a placeholder for a category, and its inclusion doesn't seem to contribute to the core concept of entropy addition. The diagram is a simplified visual representation of a more complex mathematical concept.