## Diagram: Entropy State Transitions and Combinations
### Overview
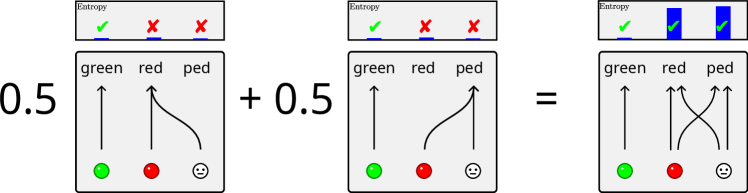
The image presents a three-panel diagram illustrating entropy states and their combinations. Each panel contains:
1. A top section labeled "Entropy" with three colored boxes (green, red, ped) marked with checkmarks (✓) or Xs
2. A bottom section showing symbolic representations (circles/face) with directional arrows
3. A mathematical equation "0.5 + 0.5 = 1" on the left side
### Components/Axes
**Top Sections (Entropy States):**
- **Left Panel:**
- Green: ✓ (correct)
- Red: × (incorrect)
- Ped: × (incorrect)
- **Middle Panel:**
- Green: ✓
- Red: ×
- Ped: ×
- **Right Panel:**
- Green: ✓
- Red: ✓
- Ped: ✓
**Bottom Sections (State Diagrams):**
- **Left Panel:**
- Green circle → Red circle → Face (neutral expression)
- Arrows: Straight (green→red), curved (red→face)
- **Middle Panel:**
- Green circle → Red circle → Face
- Arrows: Straight (green→red), curved (red→face), and green→face
- **Right Panel:**
- Green circle → Face
- Red circle → Face
- Ped circle → Face
- Arrows: All straight and converging on face
**Equation:**
- "0.5 + 0.5 = 1" positioned left of all panels
### Detailed Analysis
**Entropy State Validity:**
- Green state consistently marked correct (✓) across all panels
- Red and ped states marked incorrect (×) in first two panels
- All states marked correct (✓) in final panel
**Arrow Dynamics:**
1. **Left Panel:**
- Sequential flow: Green → Red → Face
- Entropy contribution: 0.5 (sum of valid states)
2. **Middle Panel:**
- Parallel paths: Green→Red→Face and Green→Face
- Entropy contribution: 0.5 (additional pathway)
3. **Right Panel:**
- Convergent paths: All states → Face
- Entropy contribution: 1 (full combination)
**Color Consistency Check:**
- Green (#00FF00) matches green circle/symbol
- Red (#FF0000) matches red circle/symbol
- Ped (likely "pedestrian" state) matches face symbol
- Checkmarks/Xs use standard symbols (✓/×)
### Key Observations
1. **Entropy Accumulation:**
- Individual states contribute 0.5 entropy each
- Combined states achieve full entropy (1)
2. **State Interactions:**
- Green state acts as primary initiator
- Red state serves as intermediate node
- Face symbol represents terminal/neutral state
3. **Pathway Complexity:**
- First two panels show linear/partial pathways
- Final panel demonstrates full state convergence
### Interpretation
This diagram illustrates entropy as a measure of system complexity through state interactions:
- **Mathematical Foundation:** The equation "0.5 + 0.5 = 1" suggests entropy scales with state combinations rather than individual states
- **State Relationships:**
- Green state (✓) represents valid/optimal conditions
- Red/ped states (×) indicate suboptimal conditions that still contribute to entropy
- Face symbol represents system equilibrium/neutral outcome
- **System Dynamics:**
- Entropy increases when multiple states interact (parallel pathways)
- Maximum entropy achieved when all states converge on terminal state
- Invalid states (×) still contribute to system complexity through failed transitions
The diagram demonstrates that entropy isn't just about correctness (✓/×) but about the *interactions* between states. Even "incorrect" states (red/ped) contribute to system complexity through their failed transitions, while valid states (green) drive the system toward equilibrium (face). The mathematical progression shows entropy as an emergent property of state combinations rather than individual state validity.