# Technical Document Extraction: Flowchart Analysis
## Overview
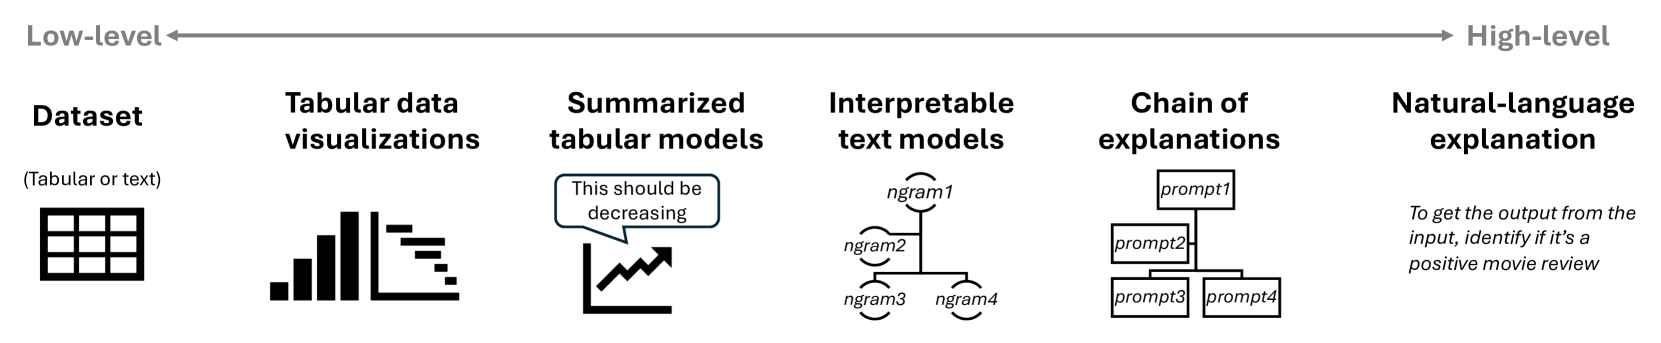
The image depicts a six-stage pipeline transitioning from **low-level** to **high-level** data processing. Each stage is represented with a label, icon, and explanatory text. Below is a detailed breakdown of all textual components.
---
### Stage 1: **Dataset**
- **Label**: `Dataset (Tabular or text)`
- **Icon**: Grid (representing tabular/text data)
- **Details**: No additional text.
---
### Stage 2: **Tabular data visualizations**
- **Label**: `Tabular data visualizations`
- **Icon**: Bar charts and line graphs
- **Details**: No additional text.
---
### Stage 3: **Summarized tabular models**
- **Label**: `Summarized tabular models`
- **Icon**: Line graph with decreasing trend
- **Embedded Text**:
> "This should be decreasing" (annotated on the graph)
---
### Stage 4: **Interpretable text models**
- **Label**: `Interpretable text models`
- **Icon**: Flowchart with hierarchical nodes
- **Node Labels**:
- `ngram1` (root node)
- `ngram2` (child of `ngram1`)
- `ngram3` and `ngram4` (children of `ngram2`)
---
### Stage 5: **Chain of explanations**
- **Label**: `Chain of explanations`
- **Icon**: Flowchart with hierarchical prompts
- **Prompt Labels**:
- `prompt1` (root node)
- `prompt2` (child of `prompt1`)
- `prompt3` and `prompt4` (children of `prompt2`)
---
### Stage 6: **Natural-language explanation**
- **Label**: `Natural-language explanation`
- **Text**:
> "To get the output from the input, identify if it’s a positive movie review"
---
### Pipeline Flow
- **Direction**: Left-to-right (low-level → high-level)
- **Key Transition**:
- Raw data (`Dataset`) → Visualizations → Summarized models → Interpretable text models → Explanation chain → Final natural-language output.
---
### Notes
1. No numerical data, heatmaps, or tables are present.
2. All labels and embedded text are transcribed verbatim.
3. Flowchart structure is preserved in the description.