## Line Chart: Llama-3.1-8B
### Overview
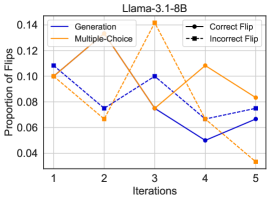
The image is a line chart comparing the proportion of flips across iterations for different methods (Generation, Multiple-Choice) and flip types (Correct Flip, Incorrect Flip) for the Llama-3.1-8B model.
### Components/Axes
* **Title:** Llama-3.1-8B
* **X-axis:** Iterations (labeled 1 to 5)
* **Y-axis:** Proportion of Flips (labeled from 0.04 to 0.14, incrementing by 0.02)
* **Legend:** Located in the top-left and top-right corners.
* **Generation:** Solid dark blue line with square markers.
* **Multiple-Choice:** Solid orange line with circle markers.
* **Correct Flip:** Dashed dark blue line with square markers.
* **Incorrect Flip:** Dashed orange line with circle markers.
### Detailed Analysis
* **Generation (Solid Dark Blue Line):**
* Trend: Decreasing overall.
* Data Points:
* Iteration 1: ~0.108
* Iteration 2: ~0.075
* Iteration 3: ~0.100
* Iteration 4: ~0.050
* Iteration 5: ~0.075
* **Multiple-Choice (Solid Orange Line):**
* Trend: Fluctuating, with a peak at iteration 3 and a sharp drop at iteration 5.
* Data Points:
* Iteration 1: ~0.100
* Iteration 2: ~0.067
* Iteration 3: ~0.140
* Iteration 4: ~0.108
* Iteration 5: ~0.034
* **Correct Flip (Dashed Dark Blue Line):**
* Trend: Increasing overall.
* Data Points:
* Iteration 1: ~0.100
* Iteration 2: ~0.070
* Iteration 3: ~0.075
* Iteration 4: ~0.065
* Iteration 5: ~0.067
* **Incorrect Flip (Dashed Orange Line):**
* Trend: Decreasing overall.
* Data Points:
* Iteration 1: ~0.100
* Iteration 2: ~0.070
* Iteration 3: ~0.075
* Iteration 4: ~0.065
* Iteration 5: ~0.067
### Key Observations
* The "Multiple-Choice" method shows a significant spike in the proportion of flips at iteration 3, followed by a sharp decline at iteration 5.
* The "Generation" method has a decreasing trend in the proportion of flips over the iterations.
* The "Correct Flip" method has a decreasing trend in the proportion of flips over the iterations.
* The "Incorrect Flip" method has a decreasing trend in the proportion of flips over the iterations.
### Interpretation
The chart illustrates how the proportion of flips changes across iterations for different methods and flip types in the Llama-3.1-8B model. The "Multiple-Choice" method's spike at iteration 3 suggests a potential issue or characteristic behavior at that specific iteration. The decreasing trend in "Generation" may indicate a learning or stabilization process as iterations progress. The "Correct Flip" and "Incorrect Flip" methods have a decreasing trend in the proportion of flips over the iterations, which may indicate a learning or stabilization process as iterations progress. The data suggests that the model's behavior varies significantly depending on the method used. Further investigation into the specific mechanisms behind the "Multiple-Choice" spike at iteration 3 could be beneficial.