\n
## Line Chart: Proportion of Flips vs. Iterations (Llama-3.1-8B)
### Overview
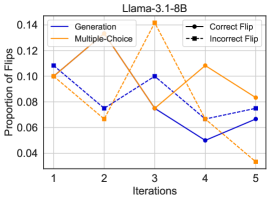
This line chart depicts the proportion of flips across different iterations for various methods: Generation, Multiple-Choice, Correct Flip, and Incorrect Flip. The chart aims to show how these proportions change as the process iterates. The title "Llama-3.1-8B" suggests this data relates to a model with that specific configuration.
### Components/Axes
* **X-axis:** Iterations (labeled 1 to 5).
* **Y-axis:** Proportion of Flips (scale from approximately 0.04 to 0.14).
* **Legend:** Located in the top-right corner.
* Generation (Blue solid line)
* Multiple-Choice (Orange dashed line)
* Correct Flip (Black solid line with circle markers)
* Incorrect Flip (Dark Blue dashed line with diamond markers)
### Detailed Analysis
The chart displays five data series, each representing a different method.
* **Generation (Blue solid line):** The line starts at approximately 0.11 at iteration 1, decreases to around 0.07 at iteration 2, rises to approximately 0.10 at iteration 3, drops to a minimum of around 0.05 at iteration 4, and then increases slightly to approximately 0.07 at iteration 5.
* **Multiple-Choice (Orange dashed line):** This line begins at approximately 0.10 at iteration 1, increases sharply to a peak of around 0.14 at iteration 3, decreases to approximately 0.11 at iteration 4, and then declines to around 0.08 at iteration 5.
* **Correct Flip (Black solid line with circle markers):** Starts at approximately 0.11 at iteration 1, decreases to around 0.08 at iteration 2, remains relatively stable at around 0.07-0.08 for iterations 3 and 4, and then drops to approximately 0.06 at iteration 5.
* **Incorrect Flip (Dark Blue dashed line with diamond markers):** Begins at approximately 0.07 at iteration 1, increases to around 0.09 at iteration 2, decreases to approximately 0.07 at iteration 3, drops to a minimum of around 0.04 at iteration 5.
Here's a table summarizing the approximate values:
| Iteration | Generation | Multiple-Choice | Correct Flip | Incorrect Flip |
|---|---|---|---|---|
| 1 | 0.11 | 0.10 | 0.11 | 0.07 |
| 2 | 0.07 | 0.08 | 0.08 | 0.09 |
| 3 | 0.10 | 0.14 | 0.07 | 0.07 |
| 4 | 0.05 | 0.11 | 0.08 | 0.06 |
| 5 | 0.07 | 0.08 | 0.06 | 0.04 |
### Key Observations
* The Multiple-Choice method exhibits the highest proportion of flips, peaking at iteration 3.
* The Generation method shows a generally decreasing trend, with a slight increase at the final iteration.
* The Incorrect Flip method has the lowest proportion of flips overall, and decreases significantly at iteration 5.
* The Correct Flip method remains relatively stable throughout the iterations.
### Interpretation
The data suggests that the Multiple-Choice method is the most sensitive to changes or "flips" within the Llama-3.1-8B model during the observed iterations. The initial decrease in Generation and Correct Flip proportions could indicate a convergence or stabilization of the model's responses. The sharp decline in Incorrect Flip proportion at iteration 5 might suggest that the model is becoming more accurate or less prone to errors. The fluctuations observed across all methods could be due to the inherent stochasticity of the model or the specific nature of the "flips" being applied. The fact that Multiple-Choice consistently shows a higher proportion of flips suggests it is more susceptible to these changes, potentially indicating a greater degree of uncertainty or variability in its responses. The model appears to be refining its responses over the iterations, as evidenced by the decreasing proportion of incorrect flips.