## Line Chart: Llama-3.1-8B - Proportion of Flips Over Iterations
### Overview
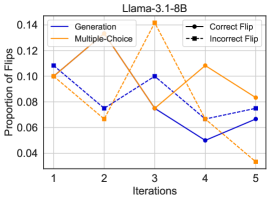
This is a line chart titled "Llama-3.1-8B" that plots the "Proportion of Flips" against "Iterations" for four distinct data series. The chart tracks changes in flip proportions across five discrete iterations, comparing two primary methods (Generation and Multiple-Choice) and two flip outcomes (Correct and Incorrect).
### Components/Axes
* **Chart Title:** "Llama-3.1-8B" (centered at the top).
* **X-Axis:** Labeled "Iterations". It has five major tick marks labeled 1, 2, 3, 4, and 5.
* **Y-Axis:** Labeled "Proportion of Flips". The scale ranges from 0.04 to 0.14, with major tick marks at 0.04, 0.06, 0.08, 0.10, 0.12, and 0.14.
* **Legend:** Located in the top-right corner of the plot area. It defines four series:
1. **Generation:** Solid blue line.
2. **Multiple-Choice:** Solid orange line.
3. **Correct Flip:** Black dashed line with circular markers.
4. **Incorrect Flip:** Black dashed line with square markers.
### Detailed Analysis
The following data points are approximate values extracted from the chart.
**1. Generation (Blue Solid Line):**
* **Trend:** Shows an overall downward trend with a significant dip at iteration 4.
* **Data Points:**
* Iteration 1: ~0.11
* Iteration 2: ~0.08
* Iteration 3: ~0.10
* Iteration 4: ~0.05 (lowest point)
* Iteration 5: ~0.07
**2. Multiple-Choice (Orange Solid Line):**
* **Trend:** Exhibits high volatility, with two peaks (iterations 2 and 4) and a sharp decline at iteration 5.
* **Data Points:**
* Iteration 1: ~0.10
* Iteration 2: ~0.12 (first peak)
* Iteration 3: ~0.08
* Iteration 4: ~0.11 (second peak)
* Iteration 5: ~0.08
**3. Correct Flip (Black Dashed Line, Circle Markers):**
* **Trend:** Features a dramatic, isolated spike at iteration 3, which is the highest value on the entire chart. Otherwise, it follows a pattern similar to the Generation line.
* **Data Points:**
* Iteration 1: ~0.11
* Iteration 2: ~0.07
* Iteration 3: ~0.14 (global maximum)
* Iteration 4: ~0.06
* Iteration 5: ~0.07
**4. Incorrect Flip (Black Dashed Line, Square Markers):**
* **Trend:** Follows a pattern very closely aligned with the Generation line, suggesting a strong correlation.
* **Data Points:**
* Iteration 1: ~0.11
* Iteration 2: ~0.08
* Iteration 3: ~0.10
* Iteration 4: ~0.05
* Iteration 5: ~0.06
### Key Observations
1. **Iteration 3 Anomaly:** The "Correct Flip" series experiences a massive, singular spike to ~0.14 at iteration 3, while all other series either dip or remain stable at that point. This is the most salient feature of the chart.
2. **Correlation:** The "Incorrect Flip" and "Generation" lines track each other almost perfectly across all iterations, indicating their proportions are tightly linked.
3. **Divergence at Iteration 4:** At iteration 4, the "Multiple-Choice" proportion rises to a peak (~0.11) while the "Generation" and "Incorrect Flip" proportions hit their lowest points (~0.05). This suggests an inverse relationship between these methods at this stage.
4. **Convergence at Start and End:** At iteration 1, three of the four series (Generation, Correct Flip, Incorrect Flip) start at approximately the same value (~0.11). By iteration 5, all four series converge within a narrow band between ~0.06 and ~0.08.
### Interpretation
The chart appears to analyze the behavior of the Llama-3.1-8B model over a series of iterative steps, likely during a training, fine-tuning, or evaluation process involving "flips" (which could refer to changes in model predictions, outputs, or states).
* **The Iteration 3 Spike:** The dramatic spike in "Correct Flip" at iteration 3 is a critical event. It suggests a specific intervention, data batch, or learning phase at that step caused a significant increase in desirable (correct) changes, without a corresponding increase in incorrect changes. This could indicate a successful learning milestone or the effect of a targeted optimization.
* **Method Comparison:** The "Multiple-Choice" method shows more volatile performance than the "Generation" method. Its peaks do not align with the "Correct Flip" spike, implying that the conditions leading to high flip rates in multiple-choice tasks are different from those that produce correct flips overall.
* **System Dynamics:** The tight coupling between "Incorrect Flip" and "Generation" proportions suggests that the generation process inherently carries a proportional risk of incorrect outcomes. The system's behavior stabilizes by iteration 5, with all metrics settling into a lower, more consistent range, possibly indicating convergence or the end of an active learning phase. The data demonstrates that flip proportions are highly sensitive to the iteration step, with specific steps (like 3 and 4) acting as pivotal points for different metrics.