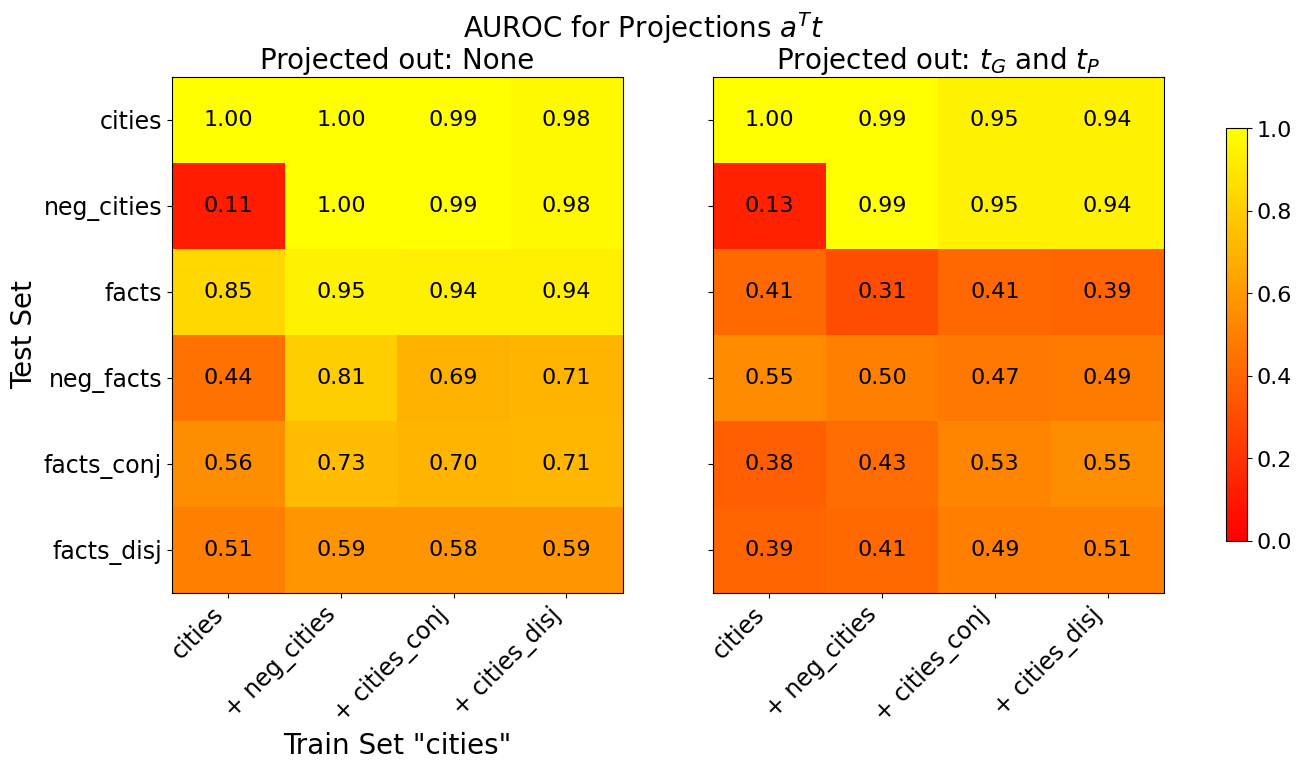
## Heatmap: AUROC for Projections a^Tt
### Overview
The image presents two heatmaps comparing the Area Under the Receiver Operating Characteristic curve (AUROC) for different projections. The left heatmap shows results when no projection is applied ("Projected out: None"), while the right heatmap shows results when projections tG and tP are applied ("Projected out: tG and tP"). The heatmaps compare performance across different test sets and training sets, with the training set fixed as "cities". The color intensity represents the AUROC score, ranging from 0.0 (red) to 1.0 (yellow).
### Components/Axes
* **Title:** AUROC for Projections a^Tt
* **Y-axis Label (Test Set):**
* cities
* neg\_cities
* facts
* neg\_facts
* facts\_conj
* facts\_disj
* **X-axis Label (Train Set "cities"):**
* cities
* + neg\_cities
* + cities\_conj
* + cities\_disj
* **Heatmap 1 Title:** Projected out: None
* **Heatmap 2 Title:** Projected out: tG and tP
* **Colorbar:** Vertical colorbar on the right side of the image, ranging from 0.0 (red) to 1.0 (yellow) in increments of 0.2.
### Detailed Analysis
**Heatmap 1: Projected out: None**
| Test Set | cities | + neg\_cities | + cities\_conj | + cities\_disj |
| :---------- | :----- | :------------ | :------------- | :------------- |
| cities | 1.00 | 1.00 | 0.99 | 0.98 |
| neg\_cities | 0.11 | 1.00 | 0.99 | 0.98 |
| facts | 0.85 | 0.95 | 0.94 | 0.94 |
| neg\_facts | 0.44 | 0.81 | 0.69 | 0.71 |
| facts\_conj | 0.56 | 0.73 | 0.70 | 0.71 |
| facts\_disj | 0.51 | 0.59 | 0.58 | 0.59 |
**Heatmap 2: Projected out: tG and tP**
| Test Set | cities | + neg\_cities | + cities\_conj | + cities\_disj |
| :---------- | :----- | :------------ | :------------- | :------------- |
| cities | 1.00 | 0.99 | 0.95 | 0.94 |
| neg\_cities | 0.13 | 0.99 | 0.95 | 0.94 |
| facts | 0.41 | 0.31 | 0.41 | 0.39 |
| neg\_facts | 0.55 | 0.50 | 0.47 | 0.49 |
| facts\_conj | 0.38 | 0.43 | 0.53 | 0.55 |
| facts\_disj | 0.39 | 0.41 | 0.49 | 0.51 |
### Key Observations
* When no projection is applied, the "cities" and "neg\_cities" test sets achieve perfect or near-perfect AUROC scores (1.00 or 0.99) when trained on any of the "cities" training sets.
* The "neg\_cities" test set has a very low AUROC score (0.11) when trained on the "cities" training set without any added negative cities when no projection is applied.
* Applying the tG and tP projections significantly reduces the AUROC scores for the "facts", "neg\_facts", "facts\_conj", and "facts\_disj" test sets.
* Applying the tG and tP projections slightly reduces the AUROC scores for the "cities" and "neg\_cities" test sets.
### Interpretation
The heatmaps illustrate the impact of applying projections tG and tP on the AUROC performance of different test sets when trained on variations of the "cities" training set. The results suggest that projecting out tG and tP significantly degrades the performance on "facts", "neg\_facts", "facts\_conj", and "facts\_disj" test sets, indicating that these projections might remove information relevant to these tasks. The "cities" and "neg\_cities" test sets are less affected, suggesting that the projections have less impact on tasks related to city classification. The low AUROC score for "neg\_cities" when trained on "cities" without added negative cities highlights the importance of including negative examples in the training data for that specific task.