## Heatmap: AUROC for Projections aᵀt
### Overview
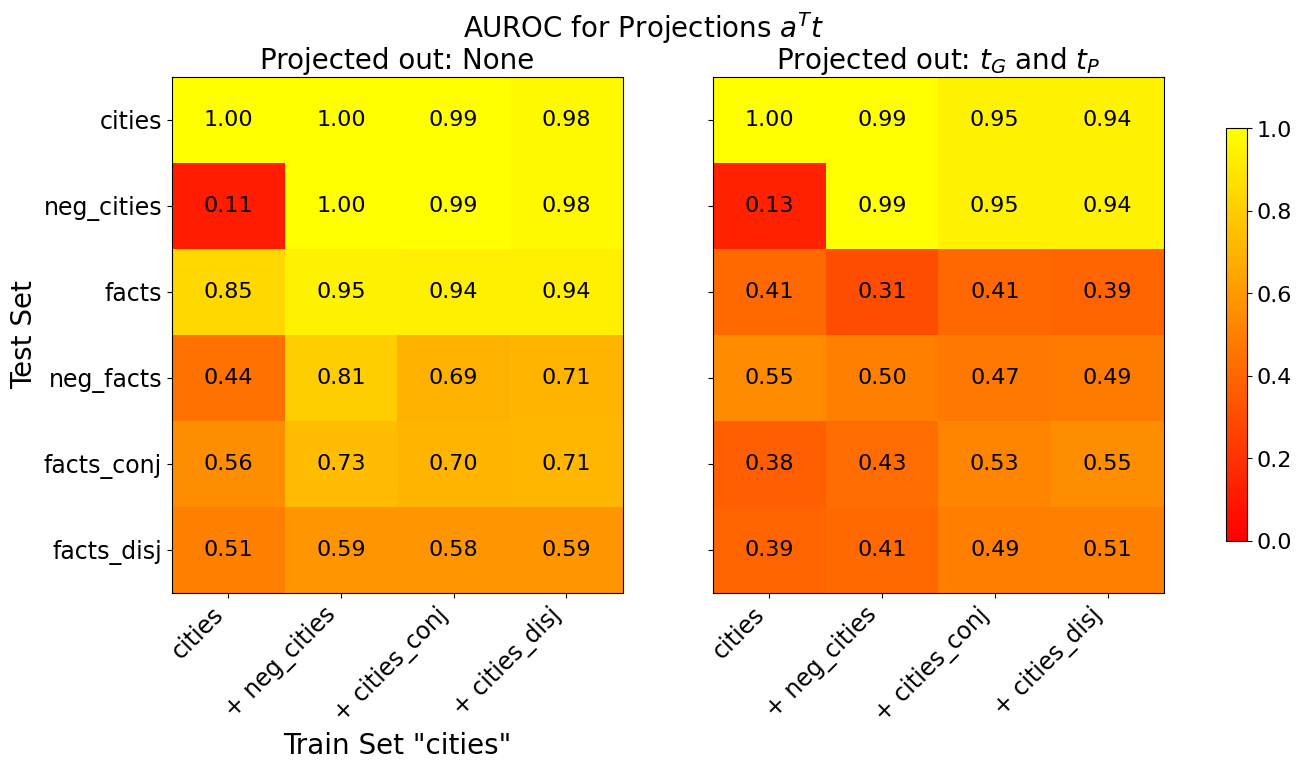
The image presents two heatmaps displaying Area Under the Receiver Operating Characteristic curve (AUROC) values for projections aᵀt. The heatmaps compare performance across different train and test sets, with varying projection conditions. The first heatmap shows results when no projections are applied ("Projected out: None"), while the second shows results when projections for τG and τP are applied ("Projected out: τG and τP").
### Components/Axes
* **Title:** "AUROC for Projections aᵀt" (centered at the top)
* **Subtitles:** "Projected out: None" (top-left) and "Projected out: τG and τP" (top-right)
* **X-axis Label:** "Train Set 'cities'" (bottom, shared by both heatmaps)
* **Y-axis Label:** "Test Set" (left, shared by both heatmaps)
* **X-axis Categories:** "cities", "+ neg\_cities", "+ cities\_conj", "+ cities\_disj"
* **Y-axis Categories:** "cities", "neg\_cities", "facts", "neg\_facts", "facts\_conj", "facts\_disj"
* **Color Scale/Legend:** Located on the right side of the image. Ranges from dark red (approximately 0.0) to yellow (approximately 1.0). The scale is linear.
* **Data Values:** Numerical values displayed within each cell of the heatmaps, representing AUROC scores.
### Detailed Analysis or Content Details
**Heatmap 1: Projected out: None**
The heatmap shows AUROC values when no projections are applied. The color intensity indicates the AUROC score, with darker red representing lower scores and yellow representing higher scores.
* **cities vs. cities:** 1.00
* **cities vs. + neg\_cities:** 1.00
* **cities vs. + cities\_conj:** 0.99
* **cities vs. + cities\_disj:** 0.98
* **neg\_cities vs. cities:** 0.11
* **neg\_cities vs. + neg\_cities:** 1.00
* **neg\_cities vs. + cities\_conj:** 0.99
* **neg\_cities vs. + cities\_disj:** 0.98
* **facts vs. cities:** 0.85
* **facts vs. + neg\_cities:** 0.95
* **facts vs. + cities\_conj:** 0.94
* **facts vs. + cities\_disj:** 0.94
* **neg\_facts vs. cities:** 0.44
* **neg\_facts vs. + neg\_cities:** 0.81
* **neg\_facts vs. + cities\_conj:** 0.69
* **neg\_facts vs. + cities\_disj:** 0.71
* **facts\_conj vs. cities:** 0.56
* **facts\_conj vs. + neg\_cities:** 0.73
* **facts\_conj vs. + cities\_conj:** 0.70
* **facts\_conj vs. + cities\_disj:** 0.71
* **facts\_disj vs. cities:** 0.51
* **facts\_disj vs. + neg\_cities:** 0.59
* **facts\_disj vs. + cities\_conj:** 0.58
* **facts\_disj vs. + cities\_disj:** 0.59
**Heatmap 2: Projected out: τG and τP**
The heatmap shows AUROC values when projections for τG and τP are applied.
* **cities vs. cities:** 1.00
* **cities vs. + neg\_cities:** 0.99
* **cities vs. + cities\_conj:** 0.95
* **cities vs. + cities\_disj:** 0.94
* **neg\_cities vs. cities:** 0.13
* **neg\_cities vs. + neg\_cities:** 0.99
* **neg\_cities vs. + cities\_conj:** 0.95
* **neg\_cities vs. + cities\_disj:** 0.94
* **facts vs. cities:** 0.41
* **facts vs. + neg\_cities:** 0.31
* **facts vs. + cities\_conj:** 0.41
* **facts vs. + cities\_disj:** 0.39
* **neg\_facts vs. cities:** 0.55
* **neg\_facts vs. + neg\_cities:** 0.50
* **neg\_facts vs. + cities\_conj:** 0.47
* **neg\_facts vs. + cities\_disj:** 0.49
* **facts\_conj vs. cities:** 0.38
* **facts\_conj vs. + neg\_cities:** 0.43
* **facts\_conj vs. + cities\_conj:** 0.53
* **facts\_conj vs. + cities\_disj:** 0.55
* **facts\_disj vs. cities:** 0.39
* **facts\_disj vs. + neg\_cities:** 0.41
* **facts\_disj vs. + cities\_conj:** 0.49
* **facts\_disj vs. + cities\_disj:** 0.51
### Key Observations
* In the first heatmap ("Projected out: None"), the AUROC scores are generally higher, particularly for the "cities" and "neg\_cities" categories. The highest scores (close to 1.0) are observed when the train and test sets are the same (e.g., "cities" vs. "cities").
* The second heatmap ("Projected out: τG and τP") shows significantly lower AUROC scores, especially for the "facts" and "neg\_facts" categories. This suggests that projecting out τG and τP negatively impacts performance on these types of data.
* The diagonal elements (train set = test set) consistently have the highest AUROC scores in both heatmaps.
* The "neg\_cities" category consistently performs poorly as a train set when tested against "facts" or "neg\_facts" in both heatmaps.
### Interpretation
The data suggests that the projections aᵀt are effective at distinguishing between "cities" and "neg\_cities" but less effective when dealing with "facts" and "neg\_facts". Projecting out τG and τP further degrades performance, particularly for the "facts" categories. This could indicate that τG and τP contain information that is important for accurately classifying facts, and removing this information leads to a loss of discriminative power.
The high AUROC scores along the diagonal indicate that the model is good at identifying instances that belong to the same category in both the train and test sets. The lower scores off-diagonal suggest that the model struggles to generalize to different categories.
The difference in performance between the two heatmaps highlights the importance of feature selection and projection techniques in machine learning. Choosing the right projections can significantly impact the accuracy and robustness of a model. The fact that projecting out τG and τP *decreases* performance suggests these projections are not simply noise, but contain useful signal for the task. Further investigation into the nature of τG and τP and their relationship to the "facts" categories could be beneficial.