## Heatmap: AUROC for Projections a^Tt
### Overview
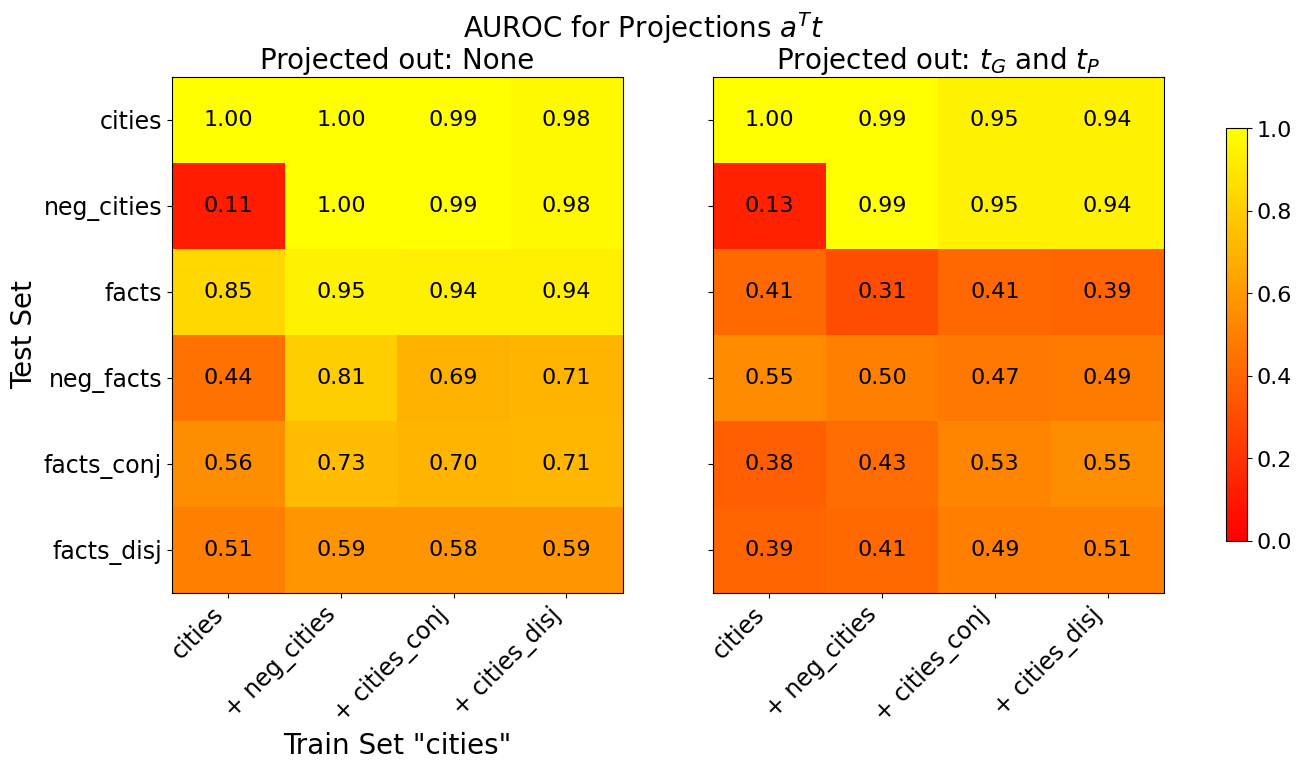
The image presents two side-by-side heatmaps comparing Area Under the Receiver Operating Characteristic (AUROC) values for model projections under two scenarios:
1. **Left**: No variables projected out (`Projected out: None`).
2. **Right**: Variables `t_G` and `t_P` projected out (`Projected out: t_G and t_P`).
The heatmaps evaluate model performance across combinations of **test sets** (rows) and **train sets** (columns), with values ranging from 0.0 (red) to 1.0 (yellow).
---
### Components/Axes
- **X-axis (Train Set "cities")**:
Subcategories:
- `cities`
- `+ neg_cities`
- `+ cities_conj`
- `+ cities_disj`
- **Y-axis (Test Set)**:
Subcategories:
- `cities`
- `neg_cities`
- `facts`
- `neg_facts`
- `facts_conj`
- `facts_disj`
- **Legend**:
A color bar on the right maps AUROC values:
- **Red**: 0.0–0.2
- **Orange**: 0.2–0.4
- **Yellow**: 0.4–0.6
- **Bright Yellow**: 0.6–0.8
- **Light Yellow**: 0.8–1.0
---
### Detailed Analysis
#### Left Heatmap (`Projected out: None`)
- **Key Values**:
- `cities` vs `cities`: 1.00 (bright yellow)
- `cities` vs `neg_cities`: 1.00 (bright yellow)
- `neg_cities` vs `cities`: 0.11 (red)
- `facts` vs `cities`: 0.85 (light yellow)
- `facts_conj` vs `cities_disj`: 0.71 (yellow)
- **Trends**:
- Highest AUROC values (1.00) occur when test and train sets match (`cities` vs `cities`, `cities` vs `neg_cities`).
- Values drop significantly when test and train sets differ (e.g., `neg_cities` vs `cities`: 0.11).
- `facts` and `facts_conj` show moderate performance (0.56–0.85).
#### Right Heatmap (`Projected out: t_G and t_P`)
- **Key Values**:
- `cities` vs `cities`: 1.00 (bright yellow)
- `cities` vs `neg_cities`: 0.99 (light yellow)
- `neg_cities` vs `cities`: 0.13 (red)
- `facts` vs `cities`: 0.41 (orange)
- `facts_conj` vs `cities_disj`: 0.55 (orange)
- **Trends**:
- Projection reduces AUROC for most combinations (e.g., `facts` vs `cities` drops from 0.85 to 0.41).
- `neg_facts` vs `cities` improves slightly (0.44 → 0.55).
- `facts_disj` vs `cities_disj` remains stable (0.59 → 0.51).
---
### Key Observations
1. **Projection Impact**:
- Projecting `t_G` and `t_P` generally **reduces AUROC** across most test-train pairs, except for `neg_facts` vs `cities` (improvement from 0.44 to 0.55).
- The largest drops occur in `facts` and `facts_conj` categories (e.g., `facts` vs `cities`: 0.85 → 0.41).
2. **Consistency**:
- `cities` vs `cities` remains perfect (1.00) in both scenarios.
- `neg_cities` vs `cities` shows minimal improvement (0.11 → 0.13).
3. **Color Consistency**:
- Red/orange dominates the right heatmap, confirming reduced performance post-projection.
---
### Interpretation
- **Model Sensitivity**:
Projecting `t_G` and `t_P` weakens the model’s ability to distinguish between `facts` and `cities` categories, likely due to loss of critical features.
- **Robustness**:
The model retains high performance when test and train sets align (`cities` vs `cities`), suggesting overfitting to the training data.
- **Anomalies**:
The slight improvement in `neg_facts` vs `cities` (0.44 → 0.55) may indicate that removing `t_G`/`t_P` reduces noise in this specific case.
- **Practical Implications**:
Projection of `t_G` and `t_P` risks degrading generalization, particularly for fact-based test sets. Retaining these variables preserves discriminative power across diverse scenarios.