## Line Graph: Acoustic Consistency Over Time (s)
### Overview
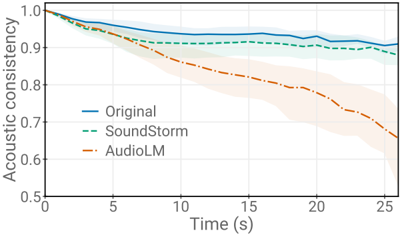
The image is a line graph comparing the acoustic consistency of three audio processing models (Original, SoundStorm, AudioLM) over a 25-second interval. Acoustic consistency is measured on a scale from 0.5 to 1.0, with shaded regions indicating variability (likely confidence intervals).
### Components/Axes
- **X-axis**: Time (s), ranging from 0 to 25 seconds in 5-second increments.
- **Y-axis**: Acoustic consistency, ranging from 0.5 to 1.0 in 0.1 increments.
- **Legend**: Located at the top-right corner, associating:
- **Solid blue line**: Original
- **Dashed green line**: SoundStorm
- **Dotted orange line**: AudioLM
- **Shaded regions**: Surround each line, representing variability (e.g., 95% confidence intervals).
### Detailed Analysis
1. **Original (Solid Blue)**:
- Starts at **1.0** at 0s.
- Declines gradually to **~0.92** by 25s.
- Shaded region narrows slightly over time, indicating reduced variability.
2. **SoundStorm (Dashed Green)**:
- Begins at **~0.95** at 0s.
- Remains relatively flat at **~0.90–0.92** throughout.
- Shaded region is wider than Original, suggesting higher variability.
3. **AudioLM (Dotted Orange)**:
- Starts at **1.0** at 0s.
- Declines sharply to **~0.65** by 25s.
- Shaded region widens significantly, indicating increasing uncertainty.
### Key Observations
- **Original** maintains the highest acoustic consistency but shows a slight downward trend.
- **SoundStorm** exhibits stability but underperforms Original over time.
- **AudioLM** experiences a dramatic decline, with consistency dropping below 0.7 after ~15s.
- All models show reduced variability (narrower shaded regions) in the first 5–10 seconds.
### Interpretation
The data suggests that **Original** and **SoundStorm** are robust for maintaining acoustic consistency, while **AudioLM** degrades significantly over time. The widening shaded regions for AudioLM imply growing uncertainty in its performance, potentially due to model instability or environmental factors. The sharp decline in AudioLM’s consistency after 15s may indicate a threshold where the model fails to adapt to temporal changes in audio input. This could highlight limitations in AudioLM’s architecture for real-time applications requiring sustained performance.