\n
## Chart: Generalization Error vs. n/d²
### Overview
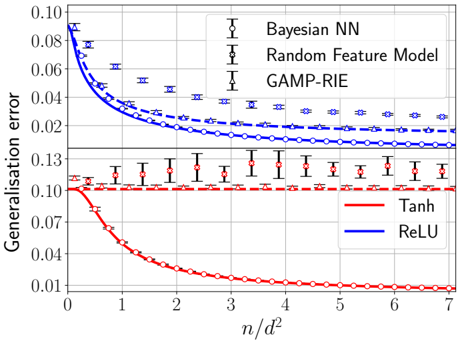
The image presents a line chart comparing the generalization error of three different models – Bayesian Neural Network (Bayesian NN), Random Feature Model, and Generalized Approximate Message Passing – Randomly Initialized Ensemble (GAMP-RIE) – as a function of the ratio *n/d²*. Each model is evaluated using two activation functions: Tanh and ReLU. Error bars are included to represent the variance in the generalization error.
### Components/Axes
* **X-axis:** Labeled "*n/d²*", ranging from approximately 0 to 7. The scale is linear.
* **Y-axis:** Labeled "*Generalisation error*", ranging from approximately 0.00 to 0.10. The scale is linear.
* **Legend:** Located in the top-right corner. It identifies the models and activation functions using colors:
* Bayesian NN (Black)
* Random Feature Model (Dark Blue)
* GAMP-RIE (Dark Grey)
* Tanh (Red)
* ReLU (Blue)
* **Data Series:** Three sets of lines, each representing a model. Each model has two lines, one for Tanh activation and one for ReLU activation.
* **Error Bars:** Vertical lines indicating the standard deviation or confidence interval around each data point.
### Detailed Analysis
Let's analyze each model's performance:
**1. Bayesian NN:**
* **Tanh (Red):** The line starts at approximately 0.09 at *n/d²* = 0, rapidly decreases to approximately 0.01 at *n/d²* = 3, and then plateaus around 0.01 for the rest of the range. Error bars are relatively small, around ±0.005, and remain fairly constant across the range.
* **ReLU (Blue):** The line starts at approximately 0.085 at *n/d²* = 0, decreases more slowly than the Tanh line, reaching approximately 0.025 at *n/d²* = 7. Error bars are larger than those for Tanh, ranging from ±0.01 to ±0.02.
**2. Random Feature Model:**
* **Tanh (Red):** The line starts at approximately 0.12 at *n/d²* = 0, and remains relatively constant around 0.11-0.13 across the entire range. Error bars are large, ranging from ±0.01 to ±0.02.
* **ReLU (Blue):** The line starts at approximately 0.07 at *n/d²* = 0, decreases to approximately 0.03 at *n/d²* = 2, and then plateaus around 0.03-0.04. Error bars are smaller than those for Tanh, ranging from ±0.005 to ±0.01.
**3. GAMP-RIE:**
* **Tanh (Red):** The line starts at approximately 0.13 at *n/d²* = 0, and remains relatively constant around 0.12-0.13 across the entire range. Error bars are large, ranging from ±0.01 to ±0.02.
* **ReLU (Blue):** The line starts at approximately 0.06 at *n/d²* = 0, decreases to approximately 0.02 at *n/d²* = 2, and then plateaus around 0.02-0.03. Error bars are smaller than those for Tanh, ranging from ±0.005 to ±0.01.
### Key Observations
* The Bayesian NN with Tanh activation consistently achieves the lowest generalization error, especially as *n/d²* increases.
* The Random Feature Model and GAMP-RIE models with Tanh activation exhibit high and relatively constant generalization error across the range of *n/d²*.
* ReLU activation generally leads to lower generalization error compared to Tanh activation for the Random Feature Model and GAMP-RIE.
* The error bars for the Tanh activation functions are consistently larger than those for the ReLU activation functions, indicating greater variance in the generalization error.
### Interpretation
The chart demonstrates the impact of model choice and activation function on generalization error. The Bayesian NN, particularly with the Tanh activation function, appears to be the most effective model in this scenario, exhibiting a significant reduction in generalization error as *n/d²* increases. This suggests that increasing the ratio of samples (*n*) to the dimensionality of the data (*d²*) improves the performance of the Bayesian NN.
The relatively constant generalization error of the Random Feature Model and GAMP-RIE with Tanh activation indicates that these models may struggle to learn effectively with the given data or require a different configuration. The improved performance of these models with ReLU activation suggests that ReLU may be a more suitable activation function for these architectures.
The larger error bars associated with the Tanh activation functions suggest that the performance of these models is more sensitive to variations in the data or training process. The consistent error bars for the ReLU activation functions suggest a more stable and reliable performance.
The chart highlights the importance of carefully selecting both the model architecture and the activation function to achieve optimal generalization performance. The ratio *n/d²* also plays a crucial role, with higher values generally leading to better performance for the Bayesian NN.