## Line Chart: Generalisation Error vs. Data-to-Parameter Ratio
### Overview
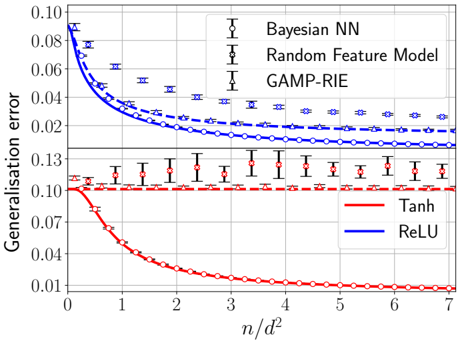
The image is a technical line chart comparing the generalisation error of three different models (Bayesian NN, Random Feature Model, GAMP-RIE) using two activation functions (Tanh, ReLU) as a function of the ratio \( n/d^2 \). The chart includes error bars for each data point.
### Components/Axes
* **Y-Axis:** Label is "Generalisation error". The scale is logarithmic, with major tick marks at 0.01, 0.02, 0.04, 0.07, 0.10. The axis spans from approximately 0.008 to 0.10.
* **X-Axis:** Label is "\( n/d^2 \)". The scale is linear, with major tick marks at integers from 0 to 7.
* **Legend (Top-Left):** Positioned in the upper-left quadrant of the plot area. It defines three model types by their marker symbols:
* `Bayesian NN`: Represented by a circle marker (`○`).
* `Random Feature Model`: Represented by a square marker (`□`).
* `GAMP-RIE`: Represented by a triangle marker (`△`).
* **Legend (Bottom-Right):** Positioned in the lower-right quadrant of the plot area. It defines two activation functions by line color:
* `Tanh`: Red line.
* `ReLU`: Blue line.
* **Data Series:** There are six distinct data series, each a combination of a model (marker) and an activation function (color). Each data point includes vertical error bars.
### Detailed Analysis
The chart plots six curves. The general trend for all blue (ReLU) curves is a decreasing generalisation error as \( n/d^2 \) increases. The red (Tanh) curves show more varied behavior.
**1. ReLU Activation (Blue Lines):**
* **Bayesian NN (Blue, Circle `○`):** Starts at the highest error (~0.10 at \( n/d^2 \approx 0.1 \)). Decreases steeply initially, then more gradually, reaching ~0.025 at \( n/d^2 = 7 \). This is the highest error curve among the ReLU models.
* **Random Feature Model (Blue, Square `□`):** Starts slightly lower than Bayesian NN (~0.09). Follows a similar decreasing trend but remains below the Bayesian NN curve, ending at ~0.018 at \( n/d^2 = 7 \).
* **GAMP-RIE (Blue, Triangle `△`):** Starts the lowest among ReLU models (~0.08). Decreases and converges very closely with the Random Feature Model curve for \( n/d^2 > 3 \), ending at ~0.017 at \( n/d^2 = 7 \).
**2. Tanh Activation (Red Lines):**
* **Bayesian NN (Red, Circle `○`):** Shows the most dramatic decrease. Starts at ~0.10 (similar to its ReLU counterpart). Drops very rapidly, crossing below all other curves by \( n/d^2 \approx 1.5 \). It continues to decrease, reaching the lowest error on the entire chart, ~0.01, at \( n/d^2 = 7 \).
* **Random Feature Model (Red, Square `□`):** Exhibits a nearly flat trend. Hovers consistently around an error of 0.10 across the entire x-axis range (from ~0.105 to ~0.095). This is the highest and most stable error curve.
* **GAMP-RIE (Red, Triangle `△`):** Shows a very slight decreasing trend. Starts near 0.10 and decreases slowly to ~0.08 at \( n/d^2 = 7 \). It remains significantly above its ReLU counterpart.
### Key Observations
1. **Activation Function Impact:** The choice of activation function (Tanh vs. ReLU) has a profound and model-dependent effect on generalisation error.
2. **Bayesian NN with Tanh:** This specific combination shows a unique, steep learning curve, achieving the best performance (lowest error) at high \( n/d^2 \).
3. **Random Feature Model with Tanh:** This combination shows almost no improvement with increasing \( n/d^2 \), suggesting a performance plateau or limitation.
4. **ReLU Consistency:** All models using ReLU show a consistent, monotonic decrease in error as \( n/d^2 \) increases, with GAMP-RIE and Random Feature Model performing similarly.
5. **Error Bars:** The error bars are generally larger for lower \( n/d^2 \) values and for the Tanh-activated Random Feature Model, indicating higher variance in those estimates.
### Interpretation
The chart investigates how model performance (generalisation error) scales with the ratio of samples (\( n \)) to the square of the input dimension (\( d^2 \)), a measure of data abundance relative to model complexity.
* **Core Finding:** The data suggests that the benefit of more data (increasing \( n/d^2 \)) is highly contingent on both the model architecture and the non-linearity (activation function) used.
* **ReLU as a Robust Choice:** For the three models tested, ReLU activation provides reliable, predictable improvement with more data. GAMP-RIE and the Random Feature Model appear particularly well-matched with ReLU.
* **Tanh's Specialized Performance:** Tanh activation creates a dichotomy. It enables the Bayesian NN to achieve superior asymptotic performance, possibly due to better compatibility with its probabilistic inference. However, it severely hampers the Random Feature Model, which fails to learn effectively regardless of data quantity. This highlights a critical hyperparameter sensitivity.
* **Practical Implication:** There is no universally "best" model. The optimal choice depends on the expected data regime (\( n/d^2 \)) and the computational/theoretical constraints that dictate the model type. For a Bayesian NN with ample data, Tanh is promising. For more consistent performance across data scales with non-Bayesian models, ReLU appears safer.
* **Underlying Principle:** The results visually demonstrate the concept of "neural tangent kernel" (NTK) theory and its limitations, where certain model-activation pairings (like ReLU with wide networks) lead to predictable, kernel-like learning curves, while others (like Tanh with certain architectures) can exhibit more complex, and sometimes less favorable, learning dynamics.