## Line Graph: Generalisation Error vs. n/d² Ratio
### Overview
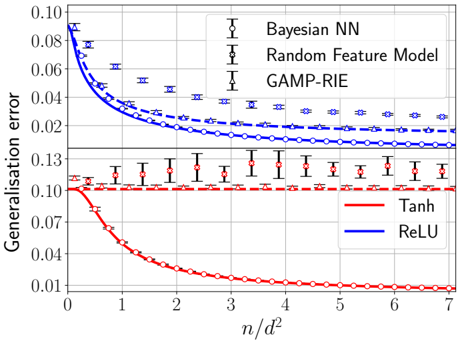
The graph compares generalisation error across different neural network architectures and activation functions as a function of the ratio n/d² (number of samples per squared dimensionality). Three blue lines represent Bayesian Neural Networks (Bayesian NN), Random Feature Models, and GAMP-RIE, while two red lines represent Tanh and ReLU activation functions. Error bars indicate variability in measurements.
### Components/Axes
- **Y-axis**: Generalisation error (0.01–0.13)
- **X-axis**: n/d² ratio (0–7)
- **Legend**:
- Blue: Bayesian NN (dashed line with circles), Random Feature Model (dotted line with crosses), GAMP-RIE (solid line with triangles)
- Red: Tanh (solid line with circles), ReLU (dashed line with crosses)
- **Grid**: Light gray background grid for reference
### Detailed Analysis
1. **Bayesian NN (Blue Dashed Line)**:
- Starts at ~0.085 error at n/d²=0
- Decreases sharply to ~0.025 by n/d²=3
- Plateaus near 0.02 with minimal error bars (<0.002)
- Error bars shrink as n/d² increases
2. **Random Feature Model (Blue Dotted Line)**:
- Begins at ~0.075 error at n/d²=0
- Declines to ~0.03 by n/d²=4
- Error bars remain larger than Bayesian NN (~0.003–0.005)
3. **GAMP-RIE (Blue Solid Line)**:
- Starts at ~0.065 error at n/d²=0
- Reduces to ~0.028 by n/d²=5
- Error bars (~0.004) larger than Bayesian NN
4. **Tanh (Red Solid Line)**:
- Begins at ~0.125 error at n/d²=0
- Drops to ~0.01 by n/d²=6
- Error bars (~0.005) larger than blue lines
5. **ReLU (Red Dashed Line)**:
- Starts at ~0.13 error at n/d²=0
- Declines to ~0.012 by n/d²=6
- Error bars (~0.006) largest among all series
### Key Observations
- **Performance Hierarchy**: Bayesian NN > Random Feature Model > GAMP-RIE > Tanh > ReLU
- **Convergence**: All models improve with increasing n/d², but Bayesian NN achieves the lowest error
- **Activation Function Tradeoff**: Tanh and ReLU show similar trends but higher errors than Bayesian approaches
- **Error Bar Trends**: Bayesian NN demonstrates the most consistent performance (smallest error bars)
### Interpretation
The data demonstrates that Bayesian Neural Networks achieve superior generalization with the smallest error margin, particularly at higher n/d² ratios. The Random Feature Model and GAMP-RIE follow in performance, while traditional activation functions (Tanh/ReLU) lag behind. The error bars suggest Bayesian methods provide more reliable predictions, with variability decreasing as data scales. This implies Bayesian approaches may be preferable for high-dimensional problems where generalization is critical, despite potential computational costs. The convergence patterns indicate diminishing returns for all models beyond n/d²=5, suggesting optimal sample efficiency thresholds.