## Chart: Log Probability vs. Number of Layers
### Overview
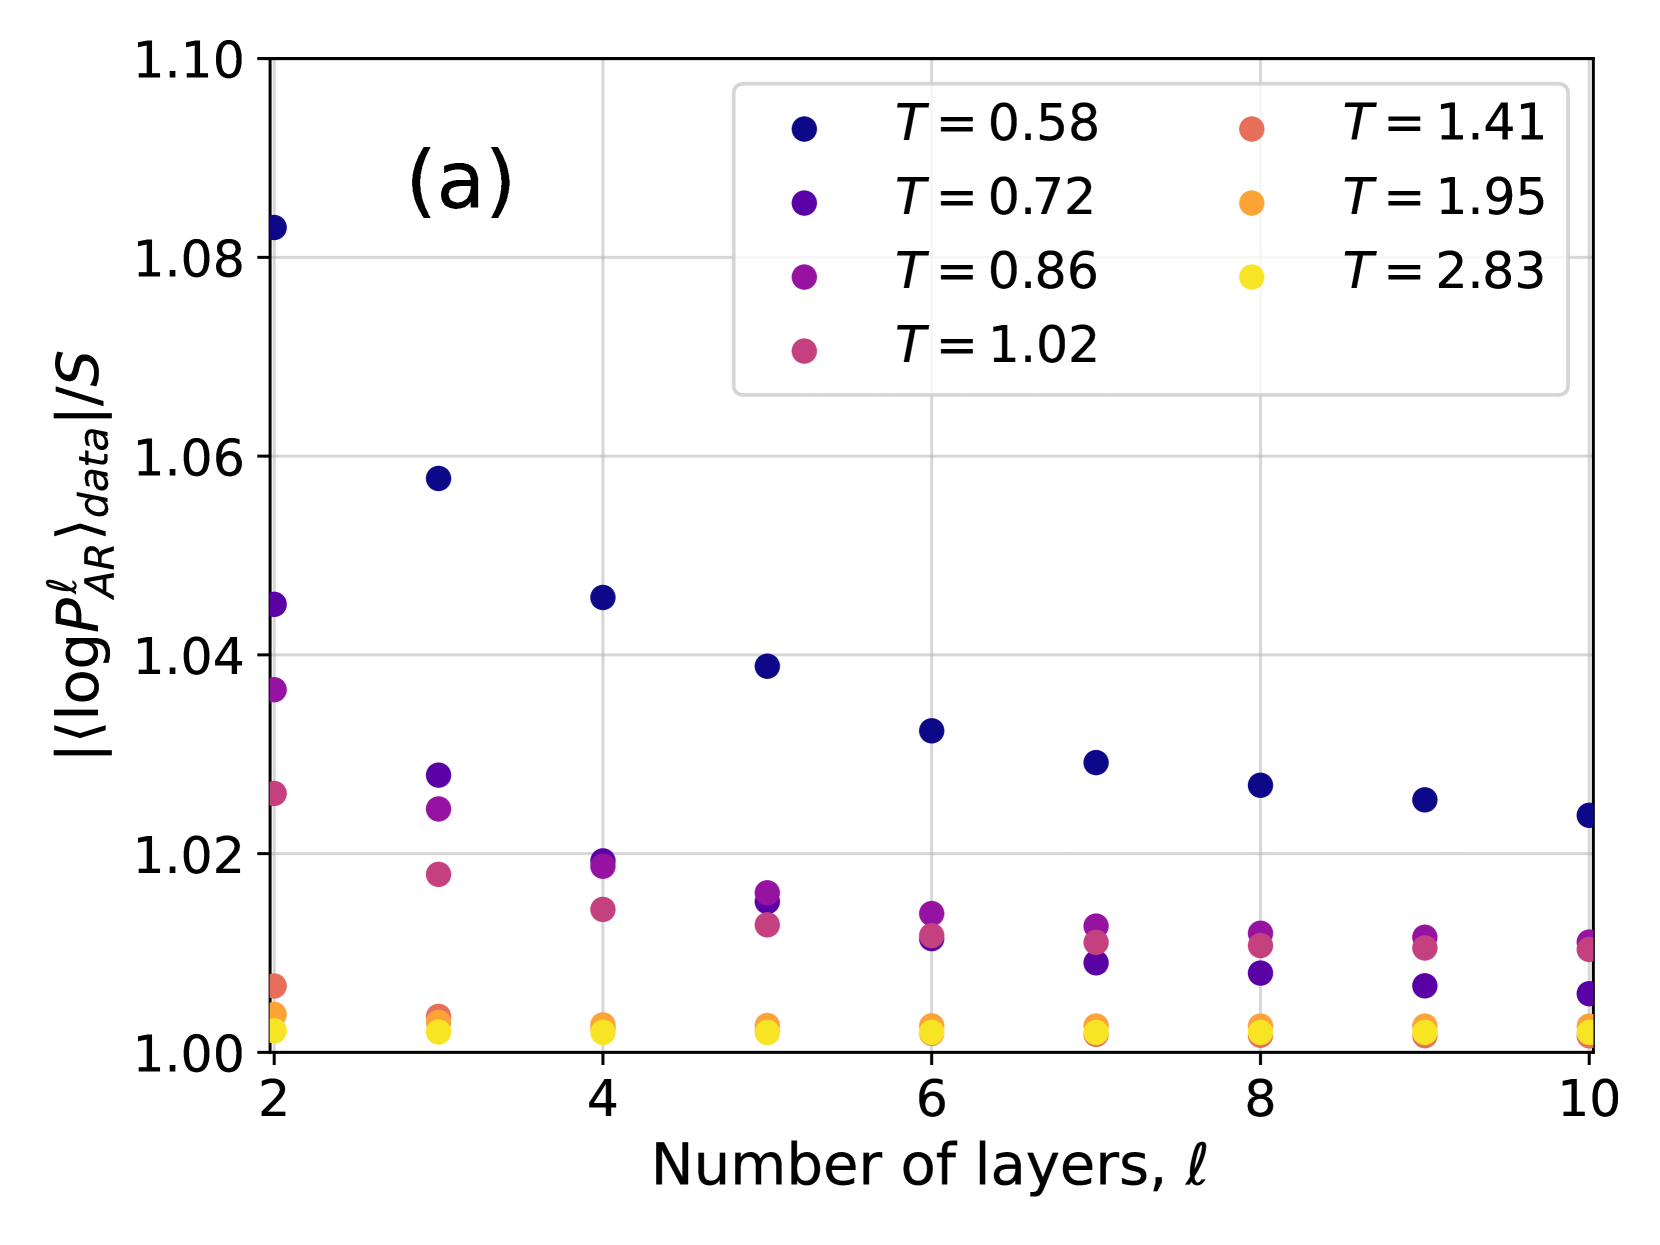
The image is a scatter plot showing the relationship between the absolute value of the log probability (averaged over data) divided by S, and the number of layers, for different temperatures (T). The plot displays data for six different temperatures, ranging from T=0.58 to T=2.83. The x-axis represents the number of layers, ranging from 2 to 10. The y-axis represents the absolute value of the log probability divided by S, ranging from 1.00 to 1.10.
### Components/Axes
* **Title:** There is no explicit title for the chart, but the plot is labeled with "(a)" in the top-left corner.
* **X-axis:** "Number of layers, l". The x-axis ranges from 2 to 10, with tick marks at every even integer.
* **Y-axis:** "|<logP<sub>AR</sub><sup>l</sup>><sub>data</sub>|/S". The y-axis ranges from 1.00 to 1.10, with tick marks at intervals of 0.02.
* **Legend:** Located in the top-right corner, the legend indicates the temperature (T) associated with each color:
* Dark Blue: T = 0.58
* Purple: T = 0.72
* Magenta: T = 0.86
* Pink: T = 1.02
* Salmon: T = 1.41
* Orange: T = 1.95
* Yellow: T = 2.83
### Detailed Analysis
Here's a breakdown of the data series for each temperature:
* **T = 0.58 (Dark Blue):** The line starts at approximately 1.085 at l=2 and decreases to approximately 1.025 at l=10. The trend is downward sloping.
* l=2: ~1.085
* l=4: ~1.05
* l=6: ~1.04
* l=8: ~1.03
* l=10: ~1.025
* **T = 0.72 (Purple):** The line starts at approximately 1.045 at l=2 and decreases to approximately 1.01 at l=10. The trend is downward sloping.
* l=2: ~1.045
* l=4: ~1.02
* l=6: ~1.015
* l=8: ~1.01
* l=10: ~1.008
* **T = 0.86 (Magenta):** The line starts at approximately 1.03 at l=2 and decreases to approximately 1.008 at l=10. The trend is downward sloping.
* l=2: ~1.03
* l=4: ~1.015
* l=6: ~1.01
* l=8: ~1.008
* l=10: ~1.006
* **T = 1.02 (Pink):** The line starts at approximately 1.02 at l=2 and decreases to approximately 1.005 at l=10. The trend is downward sloping.
* l=2: ~1.02
* l=4: ~1.01
* l=6: ~1.008
* l=8: ~1.006
* l=10: ~1.004
* **T = 1.41 (Salmon):** The line starts at approximately 1.007 at l=2 and remains relatively constant around 1.003 at l=10. The trend is relatively flat.
* l=2: ~1.007
* l=4: ~1.005
* l=6: ~1.004
* l=8: ~1.003
* l=10: ~1.002
* **T = 1.95 (Orange):** The line starts at approximately 1.003 at l=2 and remains relatively constant around 1.002 at l=10. The trend is relatively flat.
* l=2: ~1.003
* l=4: ~1.002
* l=6: ~1.002
* l=8: ~1.002
* l=10: ~1.001
* **T = 2.83 (Yellow):** The line starts at approximately 1.001 at l=2 and remains relatively constant around 1.001 at l=10. The trend is relatively flat.
* l=2: ~1.001
* l=4: ~1.001
* l=6: ~1.001
* l=8: ~1.001
* l=10: ~1.001
### Key Observations
* As the number of layers increases, the absolute value of the log probability divided by S generally decreases for lower temperatures (T = 0.58, 0.72, 0.86, 1.02).
* For higher temperatures (T = 1.41, 1.95, 2.83), the absolute value of the log probability divided by S remains relatively constant as the number of layers increases.
* The curves for higher temperatures (T = 1.41, 1.95, 2.83) are clustered closer to 1.00 compared to the curves for lower temperatures.
### Interpretation
The plot suggests that at lower temperatures, the log probability is more sensitive to the number of layers, as indicated by the steeper downward slopes. This could imply that the model's performance or predictability changes more significantly with increasing complexity (number of layers) at lower temperatures. Conversely, at higher temperatures, the log probability is less affected by the number of layers, suggesting a more stable or saturated state. The data indicates a relationship between temperature, model complexity (number of layers), and the log probability, which could be related to the model's ability to capture underlying patterns in the data. The fact that the higher temperature curves are closer to 1.00 might indicate a baseline or a more random state, where the model's predictions are less informative.