## Scatter Plot: Relationship Between Number of Layers and Log Probability Ratio
### Overview
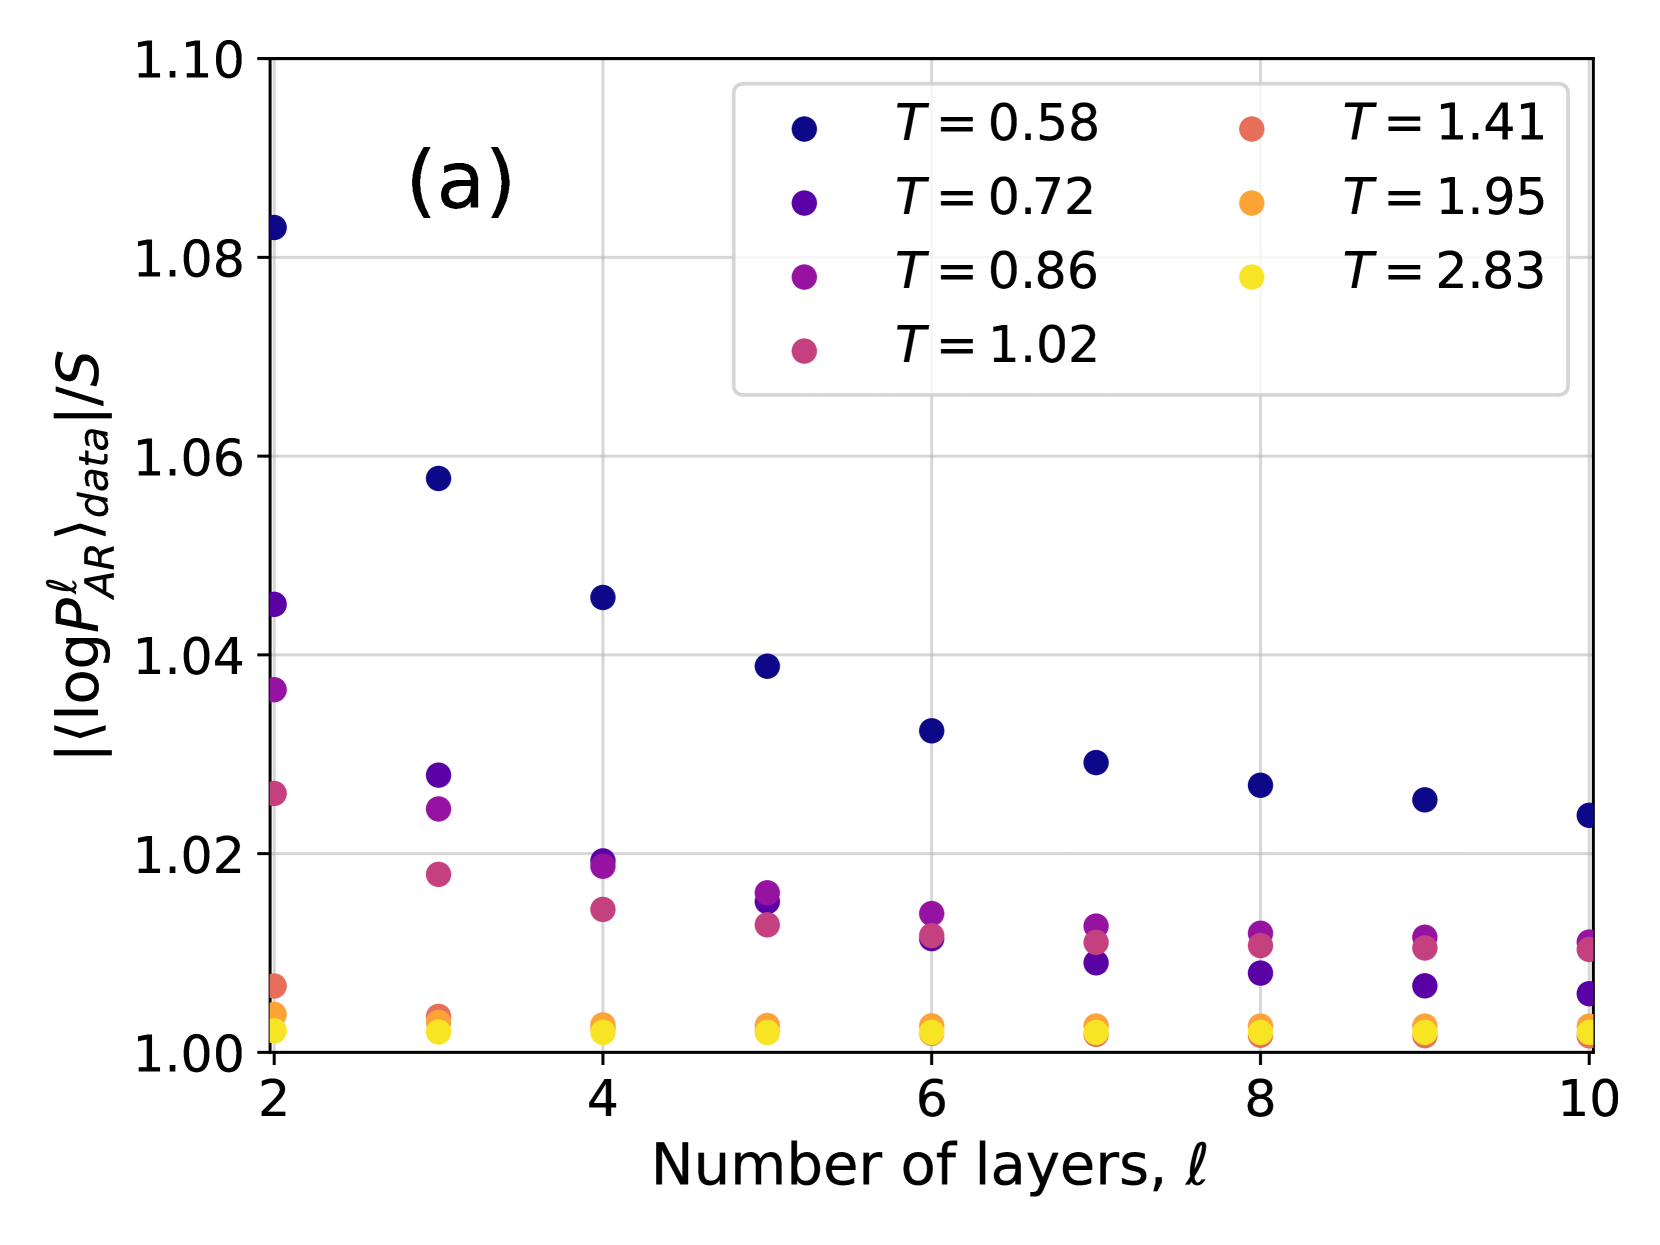
The graph illustrates the relationship between the number of layers (ℓ) and the absolute value of the average log probability ratio (|⟨logPℓ_AR⟩_data/S|) across six distinct temperature conditions (T). Data points are color-coded by temperature, with trends showing how |⟨logPℓ_AR⟩_data/S| varies with increasing ℓ for each T.
### Components/Axes
- **X-axis**: "Number of layers, ℓ" (integer values from 2 to 10).
- **Y-axis**: "|⟨logPℓ_AR⟩_data/S|" (logarithmic scale, ranging from 1.00 to 1.10).
- **Legend**: Located in the top-right corner, mapping six temperatures (T) to colors:
- Blue: T = 0.58
- Red: T = 1.41
- Purple: T = 0.72
- Orange: T = 1.95
- Magenta: T = 0.86
- Yellow: T = 2.83
### Detailed Analysis
1. **T = 0.58 (Blue)**:
- Starts at |⟨logPℓ_AR⟩_data/S| ≈ 1.08 for ℓ = 2.
- Decreases steadily to ~1.02 by ℓ = 10.
- Trend: Strong negative correlation between ℓ and |⟨logPℓ_AR⟩_data/S|.
2. **T = 1.41 (Red)**:
- Values cluster tightly between 1.00 and 1.01 across all ℓ.
- Trend: Minimal variation; nearly flat.
3. **T = 0.72 (Purple)**:
- Begins at ~1.04 for ℓ = 2.
- Decreases to ~1.01 by ℓ = 10.
- Trend: Moderate negative slope.
4. **T = 1.95 (Orange)**:
- Values remain near 1.00–1.01 for all ℓ.
- Trend: Flat, with slight upward drift at higher ℓ.
5. **T = 0.86 (Magenta)**:
- Starts at ~1.03 for ℓ = 2.
- Decreases to ~1.01 by ℓ = 10.
- Trend: Gradual decline.
6. **T = 2.83 (Yellow)**:
- Values hover around 1.00–1.01 for all ℓ.
- Trend: Completely flat, lowest magnitude across all T.
### Key Observations
- **Temperature Dependence**: Lower T values (e.g., T = 0.58, 0.72) exhibit larger |⟨logPℓ_AR⟩_data/S| and stronger ℓ-dependent trends.
- **Layer Sensitivity**: For T < 1.0, |⟨logPℓ_AR⟩_data/S| decreases with increasing ℓ. Higher T values (T ≥ 1.41) show minimal ℓ dependence.
- **Outliers**: No significant outliers; all data points align with expected trends.
### Interpretation
The data suggests that temperature modulates the sensitivity of |⟨logPℓ_AR⟩_data/S| to the number of layers. Lower temperatures amplify the ℓ-dependent trend, while higher temperatures suppress it. This could imply that thermal energy disrupts layer-specific correlations in the system. The flat behavior at high T (e.g., T = 2.83) may indicate a saturation effect, where layer interactions become negligible. The trend reversal (e.g., T = 0.58) highlights a critical threshold where layer interactions dominate over thermal noise.