## Line Chart: Vanilla Run with Muon
### Overview
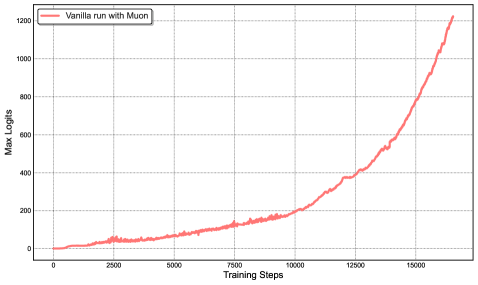
The image is a line chart showing the "Max Logits" on the y-axis versus "Training Steps" on the x-axis for a "Vanilla run with Muon". The chart displays how the maximum logits value changes over the course of training.
### Components/Axes
* **X-axis:** Training Steps, ranging from 0 to 15000, with tick marks at 0, 2500, 5000, 7500, 10000, 12500, and 15000.
* **Y-axis:** Max Logits, ranging from 0 to 1200, with tick marks at 0, 200, 400, 600, 800, 1000, and 1200.
* **Legend:** Located in the top-left corner, indicating that the red line represents "Vanilla run with Muon".
### Detailed Analysis
* **Vanilla run with Muon (Red Line):**
* From 0 to approximately 7500 training steps, the Max Logits value remains relatively low, fluctuating around 0 to 100.
* Between approximately 7500 and 12500 training steps, the Max Logits value increases gradually from approximately 100 to 400.
* From approximately 12500 to 15000 training steps, the Max Logits value increases rapidly, from approximately 400 to approximately 1200.
### Key Observations
* The "Vanilla run with Muon" shows a period of slow growth in Max Logits, followed by a period of rapid increase.
* The most significant increase in Max Logits occurs in the later stages of training (after 12500 training steps).
### Interpretation
The chart suggests that the "Vanilla run with Muon" experiences a significant learning phase after a certain number of training steps. Initially, the model's output (Max Logits) remains relatively stable, indicating that the model is not learning effectively. However, after approximately 12500 training steps, the model begins to learn rapidly, as evidenced by the steep increase in Max Logits. This could indicate a threshold effect, where the model requires a certain amount of training before it can effectively learn the underlying patterns in the data.