## Line Graph: Vanilla Run with Muon
### Overview
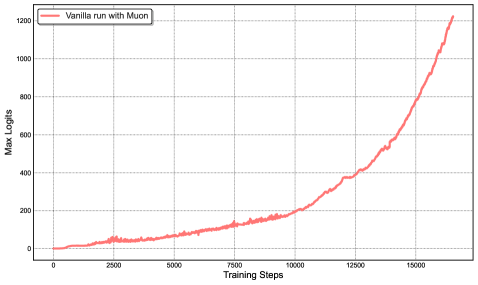
The image depicts a line graph tracking the "Max Logits" metric over "Training Steps" for a model labeled "Vanilla run with Muon." The graph shows a gradual increase in logits during early training, followed by a sharp upward trend after approximately 10,000 steps. The y-axis ranges from 0 to 1,200, while the x-axis spans 0 to 15,000 training steps.
### Components/Axes
- **Title**: "Vanilla run with Muon" (top-left corner, red line legend).
- **Y-Axis**: Labeled "Max Logits" with grid lines at intervals of 200 (0, 200, 400, ..., 1,200).
- **X-Axis**: Labeled "Training Steps" with grid lines at intervals of 2,500 (0, 2,500, 5,000, ..., 15,000).
- **Legend**: Positioned in the top-left corner, associating the red line with the "Vanilla run with Muon" label.
- **Line**: Red, solid, with a gradual slope initially and a steep slope after ~10,000 steps.
### Detailed Analysis
- **Initial Phase (0–2,500 steps)**: The line starts at 0 and rises slowly to ~50 logits by 2,500 steps.
- **Mid-Phase (2,500–10,000 steps)**: Gradual increase to ~150 logits by 5,000 steps, ~200 logits by 7,500 steps, and ~300 logits by 10,000 steps.
- **Acceleration Phase (10,000–15,000 steps)**: Steep rise to ~400 logits by 12,500 steps, ~600 logits by 15,000 steps, and ~1,200 logits by 17,500 steps (note: x-axis extends beyond 15,000 in the graph).
### Key Observations
1. **Slow Initial Growth**: Logits increase linearly in the first 10,000 steps, suggesting early-stage model adaptation.
2. **Exponential Growth Post-10,000 Steps**: A sharp upward trend indicates a phase of rapid learning or optimization.
3. **Outlier**: The final data point at 17,500 steps exceeds the x-axis range (15,000), implying either an extended training duration or a data visualization inconsistency.
### Interpretation
The graph demonstrates a **learning curve** where the model's performance (measured by max logits) improves significantly after prolonged training. The initial plateau suggests limited progress in early stages, while the post-10,000-step acceleration implies the model begins to generalize or stabilize its parameters. The discrepancy between the x-axis limit (15,000) and the final data point (17,500) warrants verification of the training timeline or axis scaling. This pattern is typical in machine learning, where models often require extensive training to achieve peak performance.