## Decision Tree: Prostate Cancer Data
### Overview
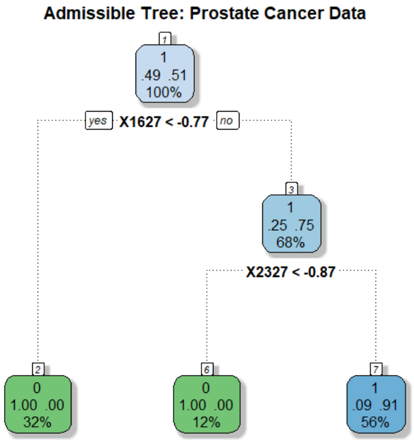
The image depicts a decision tree model, specifically an "Admissible Tree," used for analyzing prostate cancer data. The tree visually represents a series of decisions based on feature values (X1627 and X2327) that lead to different classifications or outcomes. Each node in the tree shows the predicted class (0 or 1), the distribution of classes within that node, and the percentage of samples that reach that node.
### Components/Axes
* **Title:** "Admissible Tree: Prostate Cancer Data"
* **Nodes:** Each node is represented by a rounded rectangle.
* **Node ID:** A number in the top-left corner of each node (1, 2, 3, 6, 7).
* **Class Prediction:** The predicted class (0 or 1) is displayed prominently within the node.
* **Class Distribution:** Two numbers within each node represent the distribution of classes. For example, ".49 .51" means 49% belong to class 0, and 51% belong to class 1.
* **Percentage:** The percentage below the class distribution indicates the proportion of the total dataset that falls into that node.
* **Branches:** Dotted lines connect the nodes, representing the flow of decisions.
* **Decision Rules:** Text labels along the branches indicate the decision rule used to split the data. For example, "X1627 < -0.77".
* **Decision Outcomes:** "yes" and "no" labels indicate the outcome of the decision rule.
### Detailed Analysis
* **Node 1 (Root Node):**
* ID: 1
* Class Prediction: 1
* Class Distribution: 0.49, 0.51 (approximately 49% class 0, 51% class 1)
* Percentage: 100%
* **Branch from Node 1:**
* Decision Rule: X1627 < -0.77
* Outcomes: "yes" leads to Node 2, "no" leads to Node 3.
* **Node 2:**
* ID: 2
* Class Prediction: 0
* Class Distribution: 1.00, 0.00 (100% class 0)
* Percentage: 32%
* **Node 3:**
* ID: 3
* Class Prediction: 1
* Class Distribution: 0.25, 0.75 (approximately 25% class 0, 75% class 1)
* Percentage: 68%
* **Branch from Node 3:**
* Decision Rule: X2327 < -0.87
* **Node 6:**
* ID: 6
* Class Prediction: 0
* Class Distribution: 1.00, 0.00 (100% class 0)
* Percentage: 12%
* **Node 7:**
* ID: 7
* Class Prediction: 1
* Class Distribution: 0.09, 0.91 (approximately 9% class 0, 91% class 1)
* Percentage: 56%
### Key Observations
* The root node (Node 1) has a nearly balanced class distribution (49% class 0, 51% class 1).
* The first split (X1627 < -0.77) separates the data into two branches. The "yes" branch (Node 2) leads to a node with 100% class 0, representing 32% of the total data. The "no" branch (Node 3) leads to a node with a higher proportion of class 1 (75%).
* The second split (X2327 < -0.87) further refines the classification. The "yes" branch (Node 6) leads to a node with 100% class 0, representing 12% of the total data. The "no" branch (Node 7) leads to a node with a high proportion of class 1 (91%), representing 56% of the total data.
* Nodes 2 and 6 are "pure" nodes, meaning they contain only one class (class 0).
### Interpretation
The decision tree model aims to classify prostate cancer data based on two features: X1627 and X2327. The tree demonstrates how these features can be used to separate the data into groups with different probabilities of belonging to class 0 or class 1.
The model suggests that:
* If X1627 is less than -0.77, the data point is highly likely to belong to class 0 (Node 2).
* If X1627 is not less than -0.77, and X2327 is less than -0.87, the data point is highly likely to belong to class 0 (Node 6).
* If X1627 is not less than -0.77, and X2327 is not less than -0.87, the data point is highly likely to belong to class 1 (Node 7).
The percentages associated with each node indicate the relative importance of each decision path. The path leading to Node 7 (56%) is the most common, suggesting that the condition "X1627 >= -0.77 and X2327 >= -0.87" is the most prevalent in the dataset.
The model could be used to predict the class of new data points based on their X1627 and X2327 values. It also provides insights into the relationships between these features and the outcome variable (prostate cancer classification).