\n
## Decision Tree Diagram: Admissible Tree for Prostate Cancer Data
### Overview
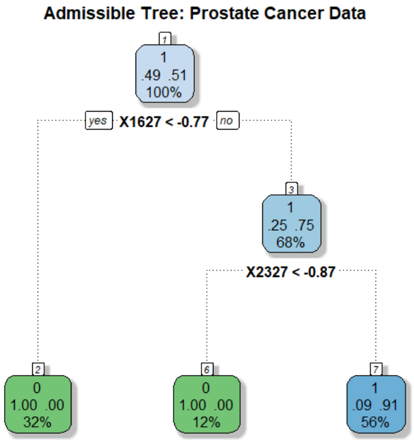
The image displays a binary decision tree model trained on prostate cancer data. The tree is used for classification, predicting a binary outcome (class 0 or 1). It consists of decision nodes (internal nodes) and terminal leaf nodes, connected by branches representing decision rules based on feature thresholds.
### Components/Axes
* **Title:** "Admissible Tree: Prostate Cancer Data" (Top center).
* **Node Structure:** Each node is a rounded rectangle containing:
* A node identifier (small number in a box at the top-left corner of the node).
* A predicted class label (0 or 1).
* A distribution or value (e.g., "49 .51").
* The percentage of total samples reaching that node.
* **Decision Rules:** Text placed on the branches connecting nodes, specifying the feature and threshold used for splitting (e.g., "X1627 < -0.77").
* **Branch Labels:** "yes" and "no" labels indicate the path taken based on whether the decision rule condition is true (yes) or false (no).
* **Color Coding:**
* Light Blue Nodes (1, 3): Internal decision nodes.
* Green Nodes (2, 4): Leaf nodes predicting class **0**.
* Blue Node (7): Leaf node predicting class **1**.
### Detailed Analysis
**Spatial Layout and Node Content:**
1. **Root Node (Node 1):**
* **Position:** Top center.
* **Content:** ID `1`, Predicted Class `1`, Value `49 .51`, Sample Percentage `100%`.
* **Decision Rule:** `X1627 < -0.77`.
* **Branches:**
* **"yes" branch:** Leads to Node 2 (bottom-left).
* **"no" branch:** Leads to Node 3 (middle-right).
2. **Internal Node (Node 3):**
* **Position:** Middle-right, reached via the "no" branch from Node 1.
* **Content:** ID `3`, Predicted Class `1`, Value `25 .75`, Sample Percentage `68%`.
* **Decision Rule:** `X2327 < -0.87`.
* **Branches:**
* **"yes" branch:** Leads to Node 4 (bottom-center).
* **"no" branch:** Leads to Node 7 (bottom-right).
3. **Leaf Node (Node 2):**
* **Position:** Bottom-left.
* **Content:** ID `2`, Predicted Class `0`, Value `1.00 .00`, Sample Percentage `32%`.
* **Interpretation:** This node contains 32% of the total samples. All samples here are predicted to be class 0 (value `1.00 .00` suggests 100% probability for class 0).
4. **Leaf Node (Node 4):**
* **Position:** Bottom-center.
* **Content:** ID `4`, Predicted Class `0`, Value `1.00 .00`, Sample Percentage `12%`.
* **Interpretation:** This node contains 12% of the total samples. All samples here are predicted to be class 0.
5. **Leaf Node (Node 7):**
* **Position:** Bottom-right.
* **Content:** ID `7`, Predicted Class `1`, Value `.09 .91`, Sample Percentage `56%`.
* **Interpretation:** This node contains 56% of the total samples. The value `.09 .91` suggests a 9% probability for class 0 and a 91% probability for class 1. The predicted class is 1.
**Data Flow and Splits:**
* The root node (100% of data) is split by the rule `X1627 < -0.77`.
* **32%** of samples satisfy this (go left to Node 2, class 0).
* **68%** of samples do not satisfy this (go right to Node 3).
* The 68% of samples at Node 3 are further split by the rule `X2327 < -0.87`.
* **12%** of the total samples (a subset of the 68%) satisfy this (go left to Node 4, class 0).
* **56%** of the total samples (the remaining subset of the 68%) do not satisfy this (go right to Node 7, class 1).
### Key Observations
1. **Class Imbalance in Leaves:** The tree partitions the data into three distinct groups. Two groups (Nodes 2 & 4, totaling 44% of samples) are pure class 0 predictions. One large group (Node 7, 56% of samples) is a near-pure class 1 prediction.
2. **Feature Importance:** Only two features, `X1627` and `X2327`, are used for splitting, suggesting they are highly informative for this classification task within the "admissible" tree structure.
3. **Tree Depth:** The tree is shallow, with a maximum depth of 2 (root -> internal -> leaf), indicating a simple, interpretable model.
4. **Sample Distribution:** The majority of samples (56%) follow the path: `X1627 >= -0.77` AND `X2327 >= -0.87`, leading to a class 1 prediction.
### Interpretation
This decision tree provides a clear, rule-based model for classifying prostate cancer data. The model suggests that the outcome (class 0 or 1) can be effectively determined by a hierarchical check of two biomarkers or features (`X1627` and `X2327`).
* **Clinical Implication:** Patients with a low value of `X1627` (less than -0.77) are classified into one group (class 0). For those with higher `X1627`, a second test on `X2327` further stratifies them: low `X2327` leads to class 0, while higher `X2327` strongly indicates class 1.
* **Model Simplicity:** The "admissible" nature and shallow depth imply this tree was likely constrained for interpretability, possibly to avoid overfitting or to meet clinical guidelines for transparent decision-making.
* **Data Structure:** The clean splits and high purity in the leaf nodes (especially Nodes 2 and 4 with 100% class 0, and Node 7 with 91% class 1) indicate that the features `X1627` and `X2327` have strong discriminatory power in this dataset. The distribution percentages show how the patient population is segmented by these rules.