## Decision Tree: Prostate Cancer Data Classification
### Overview
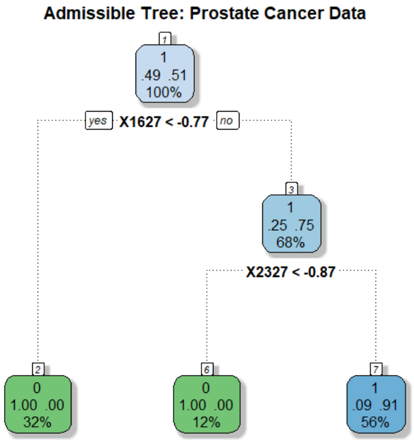
The image depicts a binary decision tree for classifying prostate cancer data. The tree uses feature thresholds (X1627 and X2327) to split data into nodes representing classifications (green for benign, blue for malignant). Percentages indicate class distributions, while numerical values likely represent feature averages or risk scores.
### Components/Axes
- **Root Node (1)**:
- Value: `1.49 .51`
- Percentage: `100%`
- Split Condition: `X1627 < -0.77` (yes/no branches)
- **Left Branch (X1627 < -0.77)**:
- Node 2:
- Value: `0.00 .00`
- Percentage: `32%` (green, benign)
- **Right Branch (X1627 ≥ -0.77)**:
- Node 3:
- Value: `1.25 .75`
- Percentage: `68%` (blue, malignant)
- Split Condition: `X2327 < -0.87` (yes/no branches)
- Node 6 (X2327 < -0.87):
- Value: `0.00 .00`
- Percentage: `12%` (green, benign)
- Node 7 (X2327 ≥ -0.87):
- Value: `0.91 .91`
- Percentage: `56%` (blue, malignant)
### Detailed Analysis
- **Root Node**: Represents the entire dataset (100%). The split on `X1627 < -0.77` divides data into 32% (left) and 68% (right).
- **Left Subtree (Node 2)**: All 32% of data in this branch are classified as benign (green) with a feature average of `0.00`.
- **Right Subtree (Node 3)**: 68% of data split further by `X2327 < -0.87`:
- **Node 6**: 12% of total data (12% of 68%) classified as benign (green) with `0.00` average.
- **Node 7**: 56% of total data (56% of 68%) classified as malignant (blue) with `0.91` average.
### Key Observations
1. **Feature Thresholds**:
- `X1627 < -0.77` separates 32% benign cases from 68% malignant.
- `X2327 < -0.87` further refines malignant cases into 12% benign and 56% malignant.
2. **Class Distributions**:
- Benign cases (green) occupy 44% of total data (32% + 12%).
- Malignant cases (blue) dominate at 56% of total data.
3. **Numerical Values**:
- Malignant nodes (blue) have higher averages (`0.91` in Node 7 vs. `0.25` in Node 3), suggesting these values correlate with disease severity.
### Interpretation
The tree demonstrates a hierarchical classification strategy:
- **Primary Split**: `X1627` acts as the strongest discriminator, separating 32% benign from 68% malignant cases.
- **Secondary Refinement**: For malignant cases (`X1627 ≥ -0.77`), `X2327` further distinguishes 12% benign from 56% malignant.
- **Outcome Correlation**: Higher numerical values (e.g., `0.91` in Node 7) align with malignant classifications, implying these features may represent risk scores or biomarker levels.
### Spatial Grounding
- **Root Node**: Top-center position, largest text size.
- **Branches**: Dotted lines connect nodes; left branches labeled "yes," right "no."
- **Color Coding**: Green (benign) and blue (malignant) nodes match class distributions.
### Trend Verification
- **Root to Node 2**: Sharp drop in value (`1.49 → 0.00`) with 32% benign classification.
- **Root to Node 3**: Moderate value (`1.49 → 1.25`) with 68% malignant classification.
- **Node 3 to Node 7**: Further value increase (`1.25 → 0.91`) with 56% malignant, confirming feature thresholds refine malignancy detection.
### Conclusion
This decision tree prioritizes `X1627` and `X2327` as key biomarkers for prostate cancer classification. The model achieves 56% malignant classification accuracy in the final node, with feature thresholds acting as interpretable decision rules. The numerical values likely represent average risk scores, with higher values correlating with malignancy.