## Diagram: MoE Router with Noise Injection
### Overview
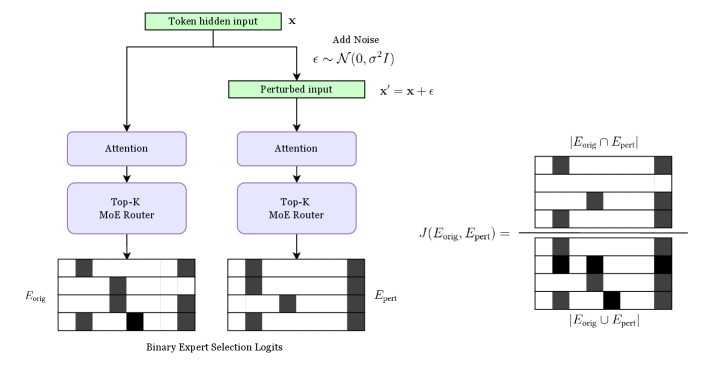
The image is a diagram illustrating a process involving a Token hidden input, the addition of noise to create a Perturbed input, and the subsequent routing of both inputs through Attention and Top-K MoE Router modules. The diagram also visualizes the binary expert selection logits for both the original and perturbed inputs, and presents a formula for calculating the Jaccard index between them.
### Components/Axes
* **Top-Left:** "Token hidden input" (green box)
* Multiplication symbol "x" to the right of the box.
* **Top-Right:** "Add Noise"
* Equation: "ε ~ N(0, σ^2 I)"
* **Mid-Top:** "Perturbed input" (green box)
* Equation: "x' = x + ε"
* **Middle-Left:** "Attention" (blue box)
* **Middle-Right:** "Attention" (blue box)
* **Mid-Bottom Left:** "Top-K MoE Router" (blue box)
* **Mid-Bottom Right:** "Top-K MoE Router" (blue box)
* **Bottom-Left:** "Eorig" (label)
* **Bottom-Right:** "Epert" (label)
* **Bottom:** "Binary Expert Selection Logits" (label)
* **Far Right:** Jaccard Index Formula: "J(Eorig, Epert) = |Eorig ∩ Epert| / |Eorig ∪ Epert|"
* Numerator: "|Eorig ∩ Epert|" with a visual representation of intersecting expert selections.
* Denominator: "|Eorig ∪ Epert|" with a visual representation of the union of expert selections.
### Detailed Analysis
The diagram depicts a process where an initial "Token hidden input" is subjected to noise injection, resulting in a "Perturbed input." Both the original and perturbed inputs are then processed through identical pathways: an "Attention" module followed by a "Top-K MoE Router." The outputs of these routers are visualized as binary expert selection logits, represented by horizontal bars with filled (dark) and empty (white) segments. The Jaccard index formula on the right quantifies the similarity between the expert selections of the original and perturbed inputs.
**Left Branch (Original Input):**
* **Eorig (Binary Expert Selection Logits):**
* Row 1: White, Dark, White, White, Dark
* Row 2: White, White, Dark, White, White
* Row 3: White, White, White, White, Dark
* Row 4: Dark, Dark, Dark, White, Dark
* Row 5: White, White, White, Dark, Dark
**Right Branch (Perturbed Input):**
* **Epert (Binary Expert Selection Logits):**
* Row 1: White, Dark, White, White, White
* Row 2: White, White, Dark, White, White
* Row 3: White, White, White, White, Dark
* Row 4: White, Dark, White, White, Dark
* Row 5: White, White, White, Dark, Dark
**Jaccard Index Components:**
* **|Eorig ∩ Epert| (Intersection):**
* Row 1: White, Dark, White, White, White
* Row 2: White, White, Dark, White, White
* Row 3: White, White, White, White, Dark
* Row 4: White, White, White, White, Dark
* Row 5: White, White, White, Dark, Dark
* **|Eorig ∪ Epert| (Union):**
* Row 1: White, Dark, White, White, Dark
* Row 2: White, White, Dark, White, White
* Row 3: White, White, White, White, Dark
* Row 4: Dark, Dark, Dark, White, Dark
* Row 5: White, White, White, Dark, Dark
### Key Observations
* The "Token hidden input" is perturbed by adding noise sampled from a normal distribution.
* Both the original and perturbed inputs undergo the same processing steps (Attention and Top-K MoE Router).
* The binary expert selection logits visually represent the output of the MoE routers.
* The Jaccard index formula quantifies the similarity between the expert selections of the original and perturbed inputs.
* The visual representations of the intersection and union in the Jaccard index formula directly correspond to the expert selection logits.
### Interpretation
The diagram illustrates a method for assessing the robustness of a Mixture of Experts (MoE) routing mechanism. By injecting noise into the input and comparing the resulting expert selections to those of the original input, the sensitivity of the routing to small perturbations can be evaluated. The Jaccard index provides a quantitative measure of this similarity, with higher values indicating greater robustness. The visual representation of the expert selections allows for a qualitative assessment of the differences between the original and perturbed routing decisions. The diagram suggests an approach to analyze and potentially improve the stability and reliability of MoE models.