\n
## Diagram: Mixture of Experts (MoE) Robustness Analysis via Input Perturbation
### Overview
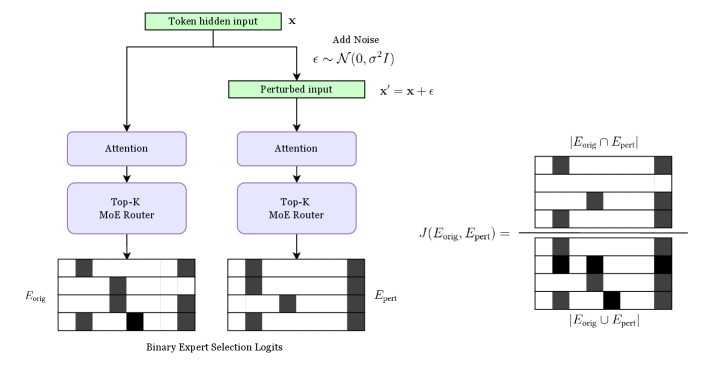
This image is a technical flowchart illustrating a process for analyzing the robustness or stability of a Mixture of Experts (MoE) model's expert selection mechanism. It demonstrates how adding Gaussian noise to a model's hidden input affects which experts are activated, and quantifies the similarity between the original and perturbed expert selection patterns using the Jaccard similarity coefficient.
### Components/Axes
The diagram is structured into three main vertical sections:
1. **Left Path (Original Processing):**
* **Input:** A green box labeled `Token hidden input x`.
* **Process Flow:** An arrow leads down to a purple box labeled `Attention`, then to another purple box labeled `Top-K MoE Router`.
* **Output:** An arrow points down to a grid labeled `E_orig` (Original Expert Selection). Below this grid is the label `Binary Expert Selection Logits`.
2. **Right Path (Perturbed Processing):**
* **Input:** A branch from the original input leads to a process labeled `Add Noise`. The noise is defined by the formula: `ϵ ~ N(0, σ²I)`. This results in a green box labeled `Perturbed input` with the formula `x' = x + ϵ`.
* **Process Flow:** Identical to the left path: `Attention` -> `Top-K MoE Router`.
* **Output:** An arrow points down to a grid labeled `E_pert` (Perturbed Expert Selection).
3. **Comparison Section (Far Right):**
* **Formula:** The Jaccard similarity coefficient is displayed: `J(E_orig, E_pert) =`.
* **Visual Representation:** The formula is visually represented as a fraction:
* **Numerator:** `|E_orig ∩ E_pert|` (Intersection of original and perturbed expert sets), shown as a grid where only cells common to both `E_orig` and `E_pert` are black.
* **Denominator:** `|E_orig ∪ E_pert|` (Union of original and perturbed expert sets), shown as a grid where any cell that is black in either `E_orig` or `E_pert` is black.
### Detailed Analysis
* **Binary Expert Selection Logits (`E_orig` & `E_pert`):** These are 4x6 grids representing the activation state of experts. Each row likely corresponds to a different token or sample, and each column to a different expert. A black cell indicates the expert was selected (logit = 1), and a white cell indicates it was not (logit = 0).
* **`E_orig` Pattern (Left Grid):** The selection pattern is sparse. For example, in the first row, the 3rd and 6th experts are selected.
* **`E_pert` Pattern (Center Grid):** The pattern is different from `E_orig`. For instance, in the first row, the 2nd and 6th experts are selected. This visually demonstrates that adding noise changed the router's decisions.
* **Jaccard Similarity Calculation:** The diagram explicitly breaks down the Jaccard index (`J = |Intersection| / |Union|`).
* The **Intersection Grid** (top right) shows only the experts selected in *both* the original and perturbed runs. For the first row, only the 6th expert is common.
* The **Union Grid** (bottom right) shows all experts selected in *either* run. For the first row, experts 2, 3, and 6 are included.
* The Jaccard value would be calculated by counting the black cells in the intersection grid and dividing by the count in the union grid. A value of 1 means perfect stability (identical selections), while 0 means complete divergence.
### Key Observations
1. **Process Symmetry:** The architecture for processing the original and perturbed inputs is identical (`Attention` -> `Top-K MoE Router`), isolating the effect of the input noise (`ϵ`) as the sole variable.
2. **Sparse Expert Activation:** Both `E_orig` and `E_pert` show sparse activation patterns (mostly white cells), which is characteristic of Top-K routing where only a few experts are activated per input.
3. **Visual Divergence:** The expert selection patterns (`E_orig` vs. `E_pert`) are visibly different, indicating that the MoE router's decisions are sensitive to small perturbations in the hidden state input.
4. **Quantification Method:** The use of the Jaccard similarity coefficient provides a clear, bounded metric (0 to 1) to quantify the stability of the expert selection process under perturbation.
### Interpretation
This diagram outlines a methodology for **probing the robustness of a Mixture of Experts model**. The core investigative question it addresses is: "How stable is the expert routing decision when the model's internal representations are slightly perturbed?"
* **What it demonstrates:** The process shows that adding Gaussian noise to a token's hidden state can lead to a different set of experts being activated by the Top-K router. The Jaccard coefficient then measures the degree of this change.
* **Why it matters:** In production systems, model inputs and internal states are subject to noise (e.g., from quantization, floating-point errors, or adversarial perturbations). A robust MoE model should exhibit relatively stable expert selection for semantically similar inputs. High Jaccard similarity under perturbation would indicate robustness, while low similarity suggests the routing mechanism is brittle and potentially unpredictable.
* **Underlying Pattern:** The diagram implies a research or evaluation workflow: 1) Process an input, 2) Record expert selections, 3) Add controlled noise, 4) Re-process and record new selections, 5) Quantify the difference. This could be used to tune the noise level (`σ²`), analyze the sensitivity of different layers, or compare the robustness of different MoE routing algorithms.
* **Peircean Insight:** The diagram is an **icon** (it visually resembles the process it describes) and a **symbol** (it uses standardized mathematical notation). It functions as an **index** by pointing to a causal relationship: the perturbation (`ϵ`) *causes* a change in expert selection, which is then measured. The entire setup is a hypothesis-testing framework made visual.