\n
## Line Chart: Training Performance Metrics
### Overview
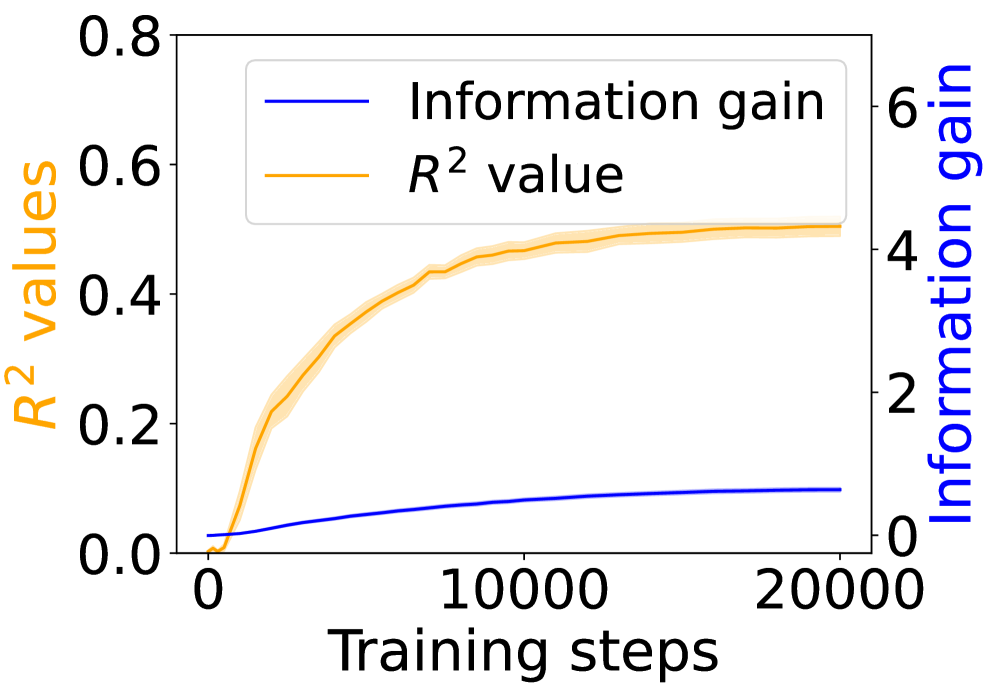
This image presents a line chart illustrating the progression of two key metrics – Information Gain and R² value – during a training process, likely for a machine learning model. The x-axis represents "Training steps," while the left y-axis represents "R² values" and the right y-axis represents "Information gain." The chart displays how these metrics change as the model undergoes training.
### Components/Axes
* **X-axis:** "Training steps" ranging from approximately 0 to 20000.
* **Left Y-axis:** "R² values" ranging from 0.0 to 0.8.
* **Right Y-axis:** "Information gain" ranging from 0 to 6.
* **Legend:** Located in the top-left corner, identifying the two lines:
* "Information gain" (Blue line)
* "R² value" (Orange line)
### Detailed Analysis
* **Information Gain (Blue Line):** The blue line representing Information Gain starts at approximately 0 at 0 training steps. It exhibits a slow, relatively linear increase throughout the training process, reaching a value of approximately 1.2 at 20000 training steps.
* **R² Value (Orange Line):** The orange line representing the R² value begins at approximately 0 at 0 training steps. It shows a rapid initial increase, leveling off as training progresses. At around 5000 training steps, the R² value reaches approximately 0.4. It continues to increase, but at a diminishing rate, reaching approximately 0.52 at 20000 training steps.
### Key Observations
* The R² value demonstrates a significant initial improvement during the first 5000 training steps, suggesting rapid learning in the early stages.
* The Information Gain increases steadily throughout the entire training process, indicating a consistent gain in knowledge or model refinement.
* The rate of improvement for the R² value decreases substantially after 5000 training steps, suggesting diminishing returns from further training.
* The Information Gain and R² value are plotted on different scales, making direct comparison challenging.
### Interpretation
The chart suggests that the model is learning effectively, as evidenced by the increasing R² value and Information Gain. The initial rapid increase in R² indicates that the model quickly captures the essential patterns in the training data. However, the diminishing rate of improvement in R² suggests that the model may be approaching its maximum performance potential or that the training data may not contain sufficient information for further significant gains. The consistent increase in Information Gain suggests that the model continues to refine its understanding of the data, even as the R² value plateaus. This could indicate that the model is learning more subtle or complex relationships that do not necessarily translate into a higher R² value. The difference in scales between the two metrics makes it difficult to determine if there is a direct correlation between the two. Further analysis might involve examining the training and validation curves to assess for overfitting.