## Scatter Plots: GFLOPS per Watt Estimation for CNN and NLP Models
### Overview
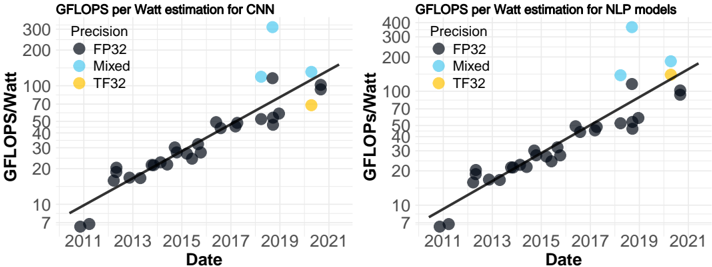
The image contains two scatter plots comparing GFLOPS per Watt estimation for CNN (Convolutional Neural Networks) and NLP (Natural Language Processing) models. Each plot shows data points representing different precision levels (FP32, Mixed, and TF32) over time (2011-2021). A trend line is included on each plot.
### Components/Axes
**Left Plot (CNN):**
* **Title:** GFLOPS per Watt estimation for CNN
* **Y-axis:** GFLOPS/Watt (labeled with values 7, 10, 20, 30, 40, 50, 70, 100, 200, 300)
* **X-axis:** Date (labeled with years 2011, 2013, 2015, 2017, 2019, 2021)
* **Legend (Top-Left):**
* FP32 (Dark Gray)
* Mixed (Light Blue)
* TF32 (Yellow)
**Right Plot (NLP):**
* **Title:** GFLOPS per Watt estimation for NLP models
* **Y-axis:** GFLOPS/Watt (labeled with values 7, 10, 20, 30, 40, 50, 70, 100, 200, 300, 400)
* **X-axis:** Date (labeled with years 2011, 2013, 2015, 2017, 2019, 2021)
* **Legend (Top-Left):**
* FP32 (Dark Gray)
* Mixed (Light Blue)
* TF32 (Yellow)
### Detailed Analysis
**Left Plot (CNN):**
* **FP32 (Dark Gray):** The majority of the data points are FP32. The trend is generally upward, indicating increasing GFLOPS/Watt over time.
* 2011: ~7 GFLOPS/Watt
* 2013: ~15 GFLOPS/Watt
* 2015: ~22 GFLOPS/Watt
* 2017: ~35 GFLOPS/Watt
* 2019: ~50 GFLOPS/Watt
* 2021: ~65 GFLOPS/Watt
* **Mixed (Light Blue):** There are two Mixed precision data points.
* 2019: ~180 GFLOPS/Watt
* 2020: ~350 GFLOPS/Watt
* **TF32 (Yellow):** There is one TF32 data point.
* 2020: ~75 GFLOPS/Watt
**Right Plot (NLP):**
* **FP32 (Dark Gray):** The majority of the data points are FP32. The trend is generally upward, indicating increasing GFLOPS/Watt over time.
* 2011: ~7 GFLOPS/Watt
* 2013: ~15 GFLOPS/Watt
* 2015: ~20 GFLOPS/Watt
* 2017: ~30 GFLOPS/Watt
* 2019: ~50 GFLOPS/Watt
* 2021: ~70 GFLOPS/Watt
* **Mixed (Light Blue):** There is one Mixed precision data point.
* 2019: ~200 GFLOPS/Watt
* **TF32 (Yellow):** There is one TF32 data point.
* 2020: ~120 GFLOPS/Watt
### Key Observations
* Both CNN and NLP models show an increasing trend in GFLOPS/Watt over time for FP32 precision.
* Mixed precision generally achieves higher GFLOPS/Watt compared to FP32 and TF32.
* The NLP plot has a higher maximum GFLOPS/Watt value (400) compared to the CNN plot (300).
* The trend lines on both plots appear to be linear.
### Interpretation
The data suggests that the energy efficiency of both CNN and NLP models has been improving over time, as indicated by the increasing GFLOPS/Watt. The use of mixed precision can significantly boost performance per watt. The difference in the Y-axis scale between the two plots suggests that NLP models may have the potential for higher energy efficiency compared to CNN models. The single data points for Mixed and TF32 precision make it difficult to draw definitive conclusions about their trends, but they indicate that these precisions can offer significant performance gains in certain years.