## Multi-Panel Analysis: Information Plots and Decision Tree
### Overview
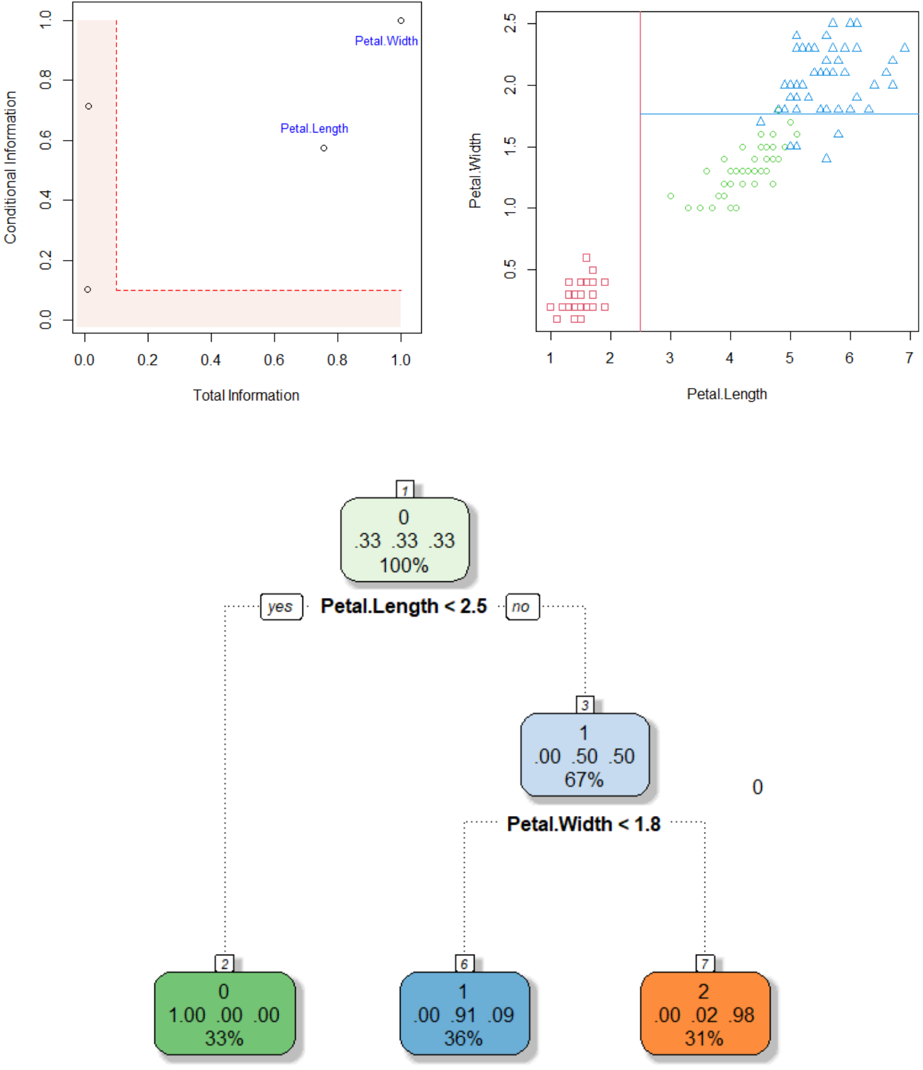
The image presents a multi-panel figure comprising two scatter plots and a decision tree. The top-left plot shows "Conditional Information" vs. "Total Information" with two labeled data points. The top-right plot displays "Petal.Width" vs. "Petal.Length" with data points distinguished by shape. The bottom panel shows a decision tree based on "Petal.Length" and "Petal.Width".
### Components/Axes
**Top-Left Plot:**
* **X-axis:** Total Information, ranging from 0.0 to 1.0 in increments of 0.2.
* **Y-axis:** Conditional Information, ranging from 0.0 to 1.0 in increments of 0.2.
* **Data Points:** Two data points are labeled "Petal.Length" and "Petal.Width".
* **Highlighted Region:** A rectangular region in the bottom-left corner is highlighted in light red. The region spans from approximately x=0 to x=0.2 and y=0 to y=0.1.
**Top-Right Plot:**
* **X-axis:** Petal.Length, ranging from 1 to 7 in increments of 1.
* **Y-axis:** Petal.Width, ranging from 0.5 to 2.5 in increments of 0.5.
* **Data Points:** Three distinct groups of data points, each represented by a different shape: squares, circles, and triangles.
* **Decision Boundaries:** A vertical red line at approximately Petal.Length = 2.75 and a horizontal blue line at approximately Petal.Width = 1.8.
**Decision Tree:**
* **Root Node:** Labeled "1", contains the values "0", ".33 .33 .33", and "100%". The decision rule is "Petal.Length < 2.5".
* **Left Child Node:** Labeled "2", contains the values "0", "1.00 .00 .00", and "33%".
* **Right Child Node:** Labeled "3", contains the values "1", ".00 .50 .50", and "67%". The decision rule is "Petal.Width < 1.8".
* **Left Grandchild Node:** Labeled "6", contains the values "1", ".00 .91 .09", and "36%".
* **Right Grandchild Node:** Labeled "7", contains the values "2", ".00 .02 .98", and "31%".
### Detailed Analysis
**Top-Left Plot:**
* The "Petal.Length" data point is located at approximately (0.75, 0.55).
* The "Petal.Width" data point is located at approximately (0.9, 0.95).
* Two additional unlabeled data points are present at approximately (0.02, 0.1) and (0.02, 0.7).
**Top-Right Plot:**
* Squares (likely representing one class) are clustered in the bottom-left corner, with Petal.Length ranging from 1 to 2.5 and Petal.Width ranging from 0.2 to 0.6.
* Circles (likely representing another class) are clustered in the middle, with Petal.Length ranging from 3 to 5 and Petal.Width ranging from 1.0 to 1.8.
* Triangles (likely representing a third class) are clustered in the top-right corner, with Petal.Length ranging from 4.5 to 7 and Petal.Width ranging from 1.4 to 2.5.
**Decision Tree:**
* The root node splits the data based on "Petal.Length < 2.5".
* The right child node further splits the data based on "Petal.Width < 1.8".
* The values within each node likely represent class distributions and percentages.
### Key Observations
* The top-left plot seems to represent some information gain or feature importance metric for Petal Length and Petal Width.
* The top-right plot shows a clear separation of three classes based on Petal.Length and Petal.Width.
* The decision tree attempts to classify the data based on these two features.
### Interpretation
The image illustrates a classification problem, likely involving different species of Iris flowers, where the goal is to predict the species based on Petal.Length and Petal.Width. The scatter plot shows that these two features are effective in separating the classes. The decision tree provides a simple rule-based approach to classification, using thresholds on Petal.Length and Petal.Width to assign data points to different classes. The values in the decision tree nodes likely represent the proportion of each class within that node. The highlighted region in the top-left plot might indicate a region of low information or high uncertainty.