## Decision Tree: Iris Dataset Analysis
### Overview
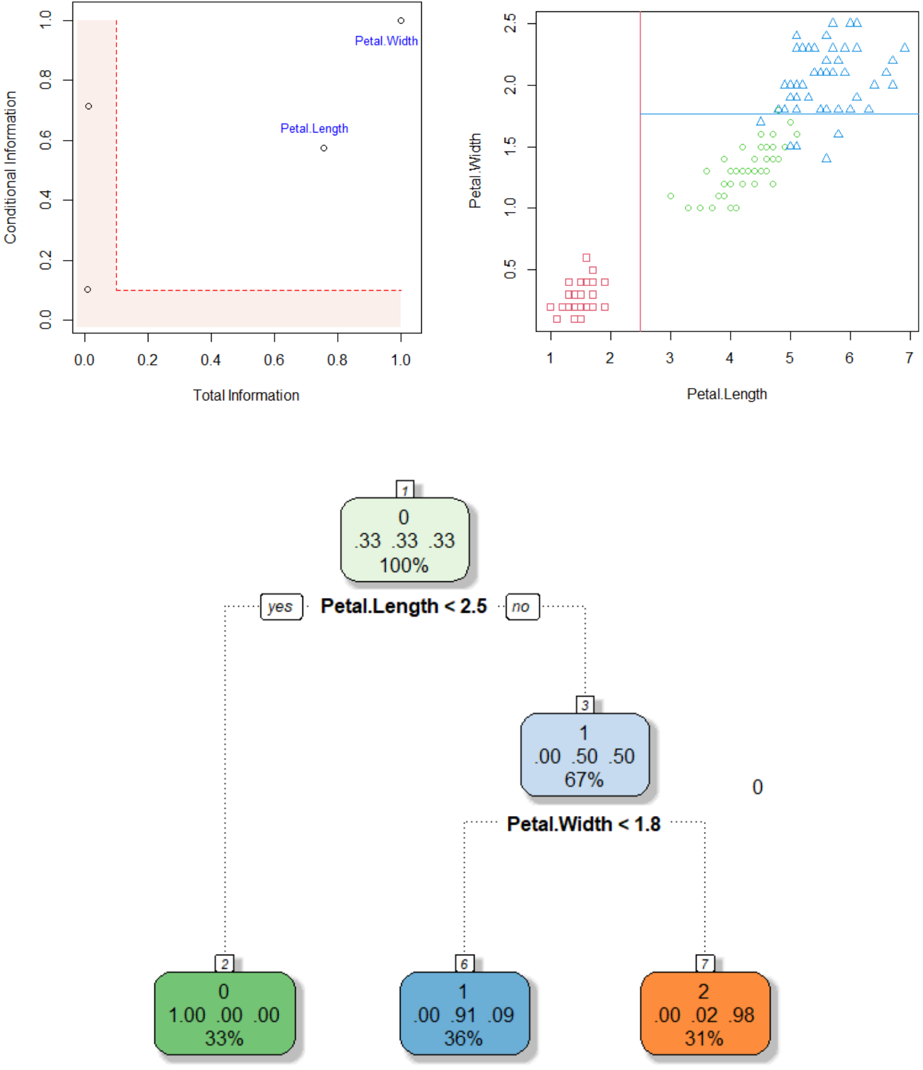
The image presents a decision tree visualizing the classification of the Iris dataset based on petal length and petal width. The top portion of the image contains two scatter plots, likely used in the construction or understanding of the decision tree. The bottom portion displays the decision tree itself, with node splits and resulting classifications.
### Components/Axes
* **Top-Left Scatter Plot:**
* X-axis: Total Information (0.0 to 1.0)
* Y-axis: Conditional Information (0.0 to 1.0)
* Data Points: Two labeled points: "Petal Length" and "Petal Width".
* **Top-Right Scatter Plot:**
* X-axis: Petal Length (1.0 to 7.0)
* Y-axis: Petal Width (0.0 to 2.5)
* Data Points: Three distinct types of markers: circles, squares, and triangles.
* **Decision Tree:**
* Root Node: "Petal.Length < 2.5"
* Second Level Nodes: "Petal.Width < 1.8" (under the "no" branch)
* Leaf Nodes: Representing classifications with counts, probabilities, and percentages.
* **Legend (within Decision Tree Nodes):**
* Number: Total samples at the node.
* First Value: Number of samples belonging to class 0.
* Second Value: Probability of class 0.
* Third Value: Percentage of class 0.
### Detailed Analysis or Content Details
**Top-Left Scatter Plot:**
The plot shows the relationship between Total Information and Conditional Information for "Petal Length" and "Petal Width". "Petal Length" is located at approximately (0.8, 0.2), while "Petal Width" is at approximately (0.2, 0.8).
**Top-Right Scatter Plot:**
This plot displays the distribution of petal length versus petal width.
* **Circles:** Appear to be concentrated around Petal Length values between 4 and 6, and Petal Width values between 1.0 and 2.5.
* **Squares:** Appear to be concentrated around Petal Length values between 1.5 and 3.0, and Petal Width values between 0.5 and 1.5.
* **Triangles:** Appear to be concentrated around Petal Length values between 4.5 and 7.0, and Petal Width values between 1.5 and 2.5.
**Decision Tree:**
* **Root Node (Petal.Length < 2.5):** Contains 7 samples.
* "yes" branch leads to a leaf node with 2 samples.
* Class 0: 0 samples (0.00, 0.00%)
* Class 1: 2 samples (1.00, 100.00%)
* Percentage of Class 1: 33%
* "no" branch leads to a second-level node (Petal.Width < 1.8).
* **Second Level Node (Petal.Width < 1.8):** Contains 5 samples.
* "yes" branch leads to a leaf node with 1 sample.
* Class 0: 1 sample (0.00, 91.09%)
* Class 1: 0 samples (0.00, 9.09%)
* Percentage of Class 1: 33%
* "no" branch leads to a leaf node with 2 samples.
* Class 0: 2 samples (0.02, 98%)
* Class 1: 0 samples (0.00, 2%)
* Percentage of Class 1: 31%
### Key Observations
* The decision tree uses petal length as the primary splitting criterion.
* The second split is based on petal width, but only for samples where petal length is greater than or equal to 2.5.
* The leaf nodes indicate the classification of the Iris species based on the petal length and width.
* The scatter plots suggest a clear separation between the three Iris species based on petal length and width.
### Interpretation
The decision tree effectively classifies the Iris dataset based on petal length and width. The tree suggests that petal length is the most important feature for distinguishing between the species, with petal width playing a secondary role. The scatter plots visually confirm the separability of the Iris species based on these two features. The probabilities and percentages in the leaf nodes indicate the confidence of the classification at each node. The tree's structure reflects a hierarchical decision-making process, where the most informative feature is used first to split the data, and subsequent splits refine the classification based on additional features. The data suggests that the Iris species can be accurately classified using a relatively simple decision tree based on petal measurements.