## Line Chart: Importance Score Analysis Across Question and Thinking Phases
### Overview
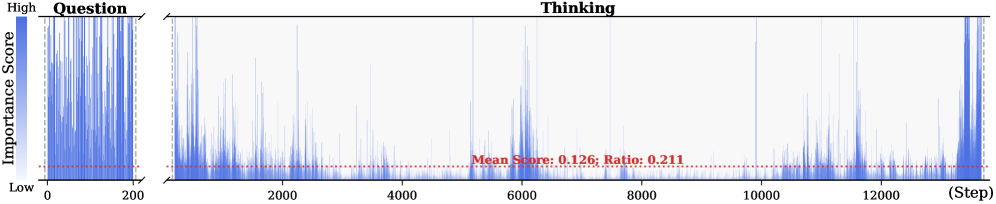
The image displays a dual-phase line chart comparing importance scores across two cognitive processes: "Question" (left) and "Thinking" (right). The chart tracks importance scores (y-axis) against sequential steps (x-axis) with distinct visual patterns in each phase. A red dashed line represents the mean score (0.126) and ratio (0.211), serving as a reference point for interpretation.
### Components/Axes
- **Y-Axis (Importance Score)**:
- Labeled "Importance Score" with a gradient from "Low" (bottom) to "High" (top).
- Scale ranges from 0 (low) to 1 (high), though no intermediate markers are visible.
- **X-Axis (Step)**:
- Labeled "Step" with numerical markers at 0, 200, 4000, 6000, 8000, 10000, and 12000.
- Divided into two sections: "Question" (0–2000 steps) and "Thinking" (2000–12000 steps).
- **Legend**:
- Positioned on the left, with blue representing "High" importance and white representing "Low" importance.
- **Red Dashed Line**:
- Labeled "Mean Score: 0.126; Ratio: 0.211" in red text, spanning both phases.
### Detailed Analysis
#### Question Phase (0–2000 Steps)
- **Visual Trend**:
- High variability with frequent sharp peaks (importance scores approaching 1) and troughs (scores near 0).
- Peaks occur at irregular intervals, suggesting episodic high-importance moments.
- **Key Data Points**:
- Multiple spikes exceed the red dashed line (mean score), indicating critical question-formation events.
#### Thinking Phase (2000–12000 Steps)
- **Visual Trend**:
- Lower overall variability compared to the "Question" phase, with most scores clustering below the red dashed line.
- Intermittent spikes (e.g., near 4000, 6000, and 12000 steps) suggest sporadic high-importance insights.
- **Key Data Points**:
- A prominent peak at ~6000 steps exceeds the mean score, potentially representing a pivotal realization.
- Final spike at 12000 steps aligns with the "Question" phase's pattern, possibly indicating a resolution or conclusion.
### Key Observations
1. **Phase Contrast**:
- The "Question" phase exhibits higher dynamic importance scores, while the "Thinking" phase is more stable but less intense.
2. **Mean Score Context**:
- The red dashed line (mean = 0.126) acts as a baseline, with most "Thinking" phase scores falling below it.
3. **Ratio Interpretation**:
- The ratio (0.211) likely reflects the proportion of steps with scores above the mean, though this requires domain-specific validation.
4. **Temporal Patterns**:
- Spikes in both phases occur at irregular intervals, suggesting non-linear cognitive processes.
### Interpretation
The chart illustrates the cognitive dynamics of problem-solving, where the "Question" phase is characterized by bursts of high-importance moments (e.g., formulating critical queries), while the "Thinking" phase involves sustained but lower-intensity processing with occasional breakthroughs. The mean score (0.126) and ratio (0.211) quantify the overall distribution, indicating that high-importance events are relatively rare but impactful. The final spike at 12000 steps may signify a resolution or synthesis of earlier insights, reinforcing the cyclical nature of cognitive work. The data underscores the importance of tracking both qualitative (spike patterns) and quantitative (mean/ratio) metrics to understand decision-making processes.