## Heatmap: Masked Column Attention
### Overview
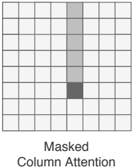
The image depicts a 5x10 grid with a single column (column 5) highlighted in varying shades of gray. The bottom of the image contains the label "Masked Column Attention" in black text. The grid lines are black, and no numerical values or additional annotations are visible.
### Components/Axes
- **Grid Structure**:
- 5 rows (vertical) and 10 columns (horizontal).
- Columns are unlabeled, but column 5 is visually distinct.
- Rows are unlabeled, but row 5 contains a darker gray cell in column 5.
- **Legend**:
- Located at the bottom center.
- Text: "Masked Column Attention" (black).
- Color: Gray (matches the highlighted column).
- **Highlighted Column**:
- Column 5 (fifth from the left) is shaded in medium gray for rows 1–4.
- Row 5, column 5, is shaded in dark gray, distinct from the rest of the column.
### Detailed Analysis
- **Grid Dimensions**:
- Total cells: 50 (5 rows × 10 columns).
- Highlighted cells: 5 (column 5, rows 1–5).
- **Shading Intensity**:
- Rows 1–4, column 5: Medium gray (consistent with the legend).
- Row 5, column 5: Dark gray (no legend entry for this shade; potential outlier or unclassified data).
- **Spatial Grounding**:
- Legend is centered at the bottom, directly below the grid.
- Highlighted column is centrally positioned horizontally (column 5 of 10).
### Key Observations
1. **Column 5 Dominance**: The entire column 5 is emphasized, suggesting it is the focus of "Masked Column Attention."
2. **Row 5 Anomaly**: The darker gray cell in row 5, column 5, deviates from the pattern of the other cells in the column. This could indicate:
- A higher attention value (if darker = higher).
- A missing/undefined value (if darker = masked).
- A categorical outlier (e.g., error, special case).
3. **Uniformity in Rows 1–4**: The consistent medium gray shading in rows 1–4 suggests a baseline level of attention across these rows.
### Interpretation
The heatmap likely visualizes attention weights in a machine learning model, where column 5 represents a specific feature or input. The uniform shading in rows 1–4 implies consistent attention across these instances, while the darker cell in row 5 may highlight:
- A critical data point requiring further investigation.
- A potential error in attention distribution (e.g., overfitting to a single instance).
- A masked value (if the darker shade represents missing data).
The absence of numerical values or a color scale limits quantitative analysis. However, the spatial emphasis on column 5 and the anomaly in row 5 suggest that this column is of particular interest in the context of the model's behavior. Further context (e.g., dataset labels, model architecture) would be needed to confirm the exact significance of these patterns.