## Histogram: Proof Length Distribution
### Overview
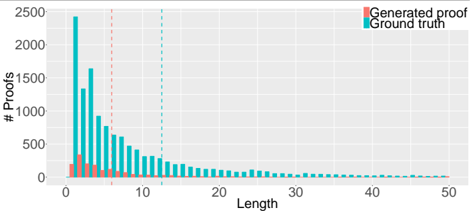
The image is a histogram comparing the distribution of proof lengths for "Generated proof" and "Ground truth" data. The x-axis represents the length of the proof, and the y-axis represents the number of proofs. The histogram shows the frequency of different proof lengths for both datasets.
### Components/Axes
* **X-axis:** "Length", ranging from 0 to 50.
* **Y-axis:** "# Proofs", ranging from 0 to 2500.
* **Legend (top-right):**
* "Generated proof" - Represented by red bars.
* "Ground truth" - Represented by teal bars.
* **Vertical dashed lines:**
* Red dashed line at approximately x=5
* Teal dashed line at approximately x=12
### Detailed Analysis
* **Ground truth (teal):**
* The distribution is heavily skewed to the right.
* The highest frequency occurs at a length of approximately 1, with a value of approximately 2400 proofs.
* The frequency decreases rapidly as the length increases.
* At length 10, the number of proofs is approximately 300.
* At length 20, the number of proofs is approximately 50.
* At length 30, the number of proofs is approximately 20.
* At length 40, the number of proofs is approximately 5.
* At length 50, the number of proofs is approximately 2.
* **Generated proof (red):**
* The distribution is also skewed to the right, but less extreme than the "Ground truth" data.
* The highest frequency occurs at a length of approximately 1, with a value of approximately 250 proofs.
* The frequency decreases as the length increases, but at a slower rate than the "Ground truth" data.
* The number of proofs is very low after length 10.
### Key Observations
* Both "Generated proof" and "Ground truth" data show a right-skewed distribution, indicating that shorter proofs are more common.
* "Ground truth" proofs are significantly more concentrated at shorter lengths compared to "Generated proof".
* The red dashed line is positioned at approximately x=5, and the teal dashed line is positioned at approximately x=12.
### Interpretation
The histogram suggests that the "Ground truth" data contains a larger number of very short proofs compared to the "Generated proof" data. The "Generated proof" data has a broader distribution, indicating a greater variety of proof lengths. The dashed lines may represent the mean or median proof length for each dataset, with the "Ground truth" proofs having a shorter average length. The data implies that the generated proofs tend to be longer than the ground truth proofs.