\n
## Histogram: Comparison of Generated Proof vs. Ground Truth Lengths
### Overview
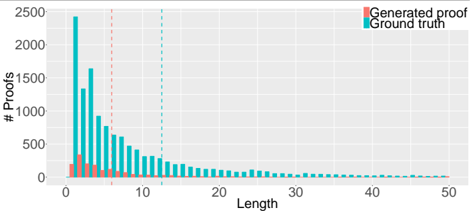
The image is a histogram comparing the frequency distribution of proof lengths for two categories: "Generated proof" and "Ground truth." The chart illustrates that proofs in the "Ground truth" dataset are significantly more numerous and tend to be longer than those in the "Generated proof" dataset.
### Components/Axes
* **Chart Type:** Histogram (Bar Chart).
* **X-Axis:** Labeled **"Length"**. It represents the length of a proof, with a scale from 0 to 50. Major tick marks are at 0, 10, 20, 30, 40, and 50.
* **Y-Axis:** Labeled **"# Proofs"**. It represents the count or frequency of proofs, with a scale from 0 to 2500. Major tick marks are at 0, 500, 1000, 1500, 2000, and 2500.
* **Legend:** Located in the **top-right corner** of the chart area.
* A **red square** is labeled **"Generated proof"**.
* A **teal (blue-green) square** is labeled **"Ground truth"**.
* **Vertical Reference Lines:**
* A **red dashed vertical line** is positioned at approximately **Length = 6**.
* A **teal dashed vertical line** is positioned at approximately **Length = 13**.
### Detailed Analysis
The data is presented as two overlapping histograms with bars for each integer length value from 1 to 50.
**1. Ground Truth (Teal Bars):**
* **Trend:** The distribution is strongly right-skewed. The frequency is highest at the shortest lengths and decreases rapidly as length increases.
* **Key Data Points (Approximate):**
* Length 1: ~2500 proofs (the global peak).
* Length 2: ~1600 proofs.
* Length 3: ~1300 proofs.
* Length 4: ~900 proofs.
* Length 5: ~700 proofs.
* The frequency continues to decline steadily. By Length 20, the count is below 200. By Length 50, the count is near zero.
* The **teal dashed line at Length ~13** likely represents a central tendency measure (e.g., median or mean) for the Ground Truth distribution.
**2. Generated Proof (Red Bars):**
* **Trend:** Also right-skewed, but with a much lower overall frequency and a shorter effective range.
* **Key Data Points (Approximate):**
* Length 1: ~200 proofs (the peak for this series).
* Length 2: ~150 proofs.
* Length 3: ~100 proofs.
* Length 4: ~70 proofs.
* The frequency drops off quickly. By Length 10, the count is very low (likely <20). The bars become negligible or invisible beyond approximately Length 15.
* The **red dashed line at Length ~6** likely represents a central tendency measure for the Generated Proof distribution.
### Key Observations
1. **Magnitude Disparity:** The "Ground truth" dataset contains orders of magnitude more proofs than the "Generated proof" dataset, especially at short lengths.
2. **Length Disparity:** The central tendency for "Ground truth" proofs (Length ~13) is more than double that of "Generated proof" proofs (Length ~6). The generated proofs are systematically shorter.
3. **Distribution Shape:** Both distributions follow a similar decaying pattern, but the "Generated proof" distribution is truncated, failing to produce proofs of longer lengths present in the ground truth.
4. **Overlap:** The red bars are visible only at the very beginning of the x-axis (Lengths 1-~12), sitting in front of the much taller teal bars.
### Interpretation
This histogram suggests a significant gap between the capabilities of a proof generation system and the actual complexity (as measured by length) of real-world proofs.
* **The data demonstrates** that the generation system primarily produces very short proofs (peaking at length 1) and its output frequency drops to near zero well before the ground truth distribution does. The system appears unable to replicate the longer, more complex proofs found in the ground truth dataset.
* **The elements relate** by showing a direct comparison on the same scale. The vertical dashed lines provide a quick visual summary of the core disparity: the "average" generated proof is less than half the length of the "average" real proof.
* **Notable anomaly/trend:** The most striking trend is the **complete absence of generated proofs beyond a certain length (~15)**, while the ground truth continues with measurable frequency up to length 50. This indicates a potential limitation or bias in the generation model towards simplicity. The system's output is not just less frequent but also fundamentally less complex than the data it is presumably trained on or meant to emulate.