## Bar Chart: Proof Distribution
### Overview
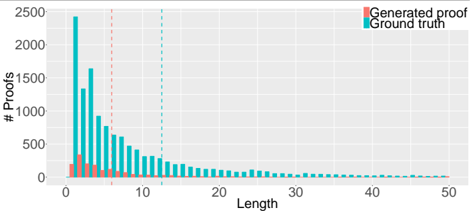
The bar chart displays the distribution of proof lengths, categorized into two groups: "Generated proof" and "Ground truth." The x-axis represents the length of the proof in units, while the y-axis shows the number of proofs.
### Components/Axes
- **X-Axis**: Labeled "Length," it ranges from 0 to 50 units.
- **Y-Axis**: Labeled "# Proofs," it ranges from 0 to 2500.
- **Legend**: Located at the top right, it differentiates between "Generated proof" (red) and "Ground truth" (blue).
### Detailed Analysis or ### Content Details
- The majority of proofs are short, with most falling between 0 and 10 units.
- There is a significant peak in the "Generated proof" category at around 5 units.
- The "Ground truth" category shows a more even distribution, with fewer proofs of any length.
- The "Generated proof" category has a slightly higher number of proofs at longer lengths compared to the "Ground truth" category.
### Key Observations
- The "Generated proof" category has a higher number of proofs at shorter lengths.
- The "Ground truth" category has a more even distribution across all lengths.
- There is a noticeable difference in the number of proofs between the two categories, with the "Generated proof" category having a higher count.
### Interpretation
The data suggests that the generated proofs tend to be shorter than the ground truth proofs. This could indicate that the generated proofs are more concise or that the ground truth proofs are more complex. The even distribution in the "Ground truth" category suggests that the generated proofs are more consistent in length. The difference in the number of proofs between the two categories could be due to the nature of the proofs being generated or the complexity of the ground truth proofs.