## Bar Chart: Comparison of Generated Proofs vs Ground Truth by Length
### Overview
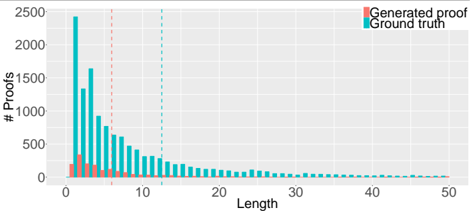
The chart compares the distribution of "Generated proof" (red bars) and "Ground truth" (blue bars) across lengths from 0 to 50. The y-axis represents the number of proofs, while the x-axis represents length. The legend is positioned in the top-right corner, with red corresponding to "Generated proof" and blue to "Ground truth."
### Components/Axes
- **X-axis (Length)**: Labeled "Length," with markers at intervals of 0, 10, 20, 30, 40, and 50.
- **Y-axis (# Proofs)**: Labeled "# Proofs," scaled from 0 to 2500 in increments of 500.
- **Legend**: Located in the top-right corner, with red for "Generated proof" and blue for "Ground truth."
### Detailed Analysis
- **Ground truth (blue)**:
- Dominates at shorter lengths, peaking at ~2500 proofs at length 0.
- Declines sharply, reaching ~1000 proofs at length 10, ~500 at length 15, and ~100 at length 20.
- Near-zero values observed from length 25 onward.
- **Generated proof (red)**:
- Starts at ~300 proofs at length 0, peaking slightly at ~400 at length 5.
- Declines gradually, maintaining ~100–200 proofs until length 20.
- Drops to near-zero by length 30, with minimal values thereafter.
### Key Observations
1. **Ground truth** exhibits a steep decline, with most proofs concentrated at shorter lengths (0–15).
2. **Generated proof** declines more gradually, persisting at non-zero values up to length 30.
3. No overlap between the two series except at length 0, where "Generated proof" is ~10% of "Ground truth."
4. Both series show near-zero values beyond length 30, suggesting a cutoff in proof generation or validation.
### Interpretation
The data suggests that "Ground truth" proofs are predominantly short, with a rapid drop-off in frequency as length increases. In contrast, "Generated proof" maintains a more sustained distribution, indicating potential differences in generation or validation criteria. The stark divergence at shorter lengths (e.g., length 0) may reflect methodological differences, such as automated generation favoring longer proofs or ground truth being manually curated for brevity. The near-zero values beyond length 30 imply a practical limit to proof complexity or scope in the dataset.