## Pressure-Temperature Phase Diagram
### Overview
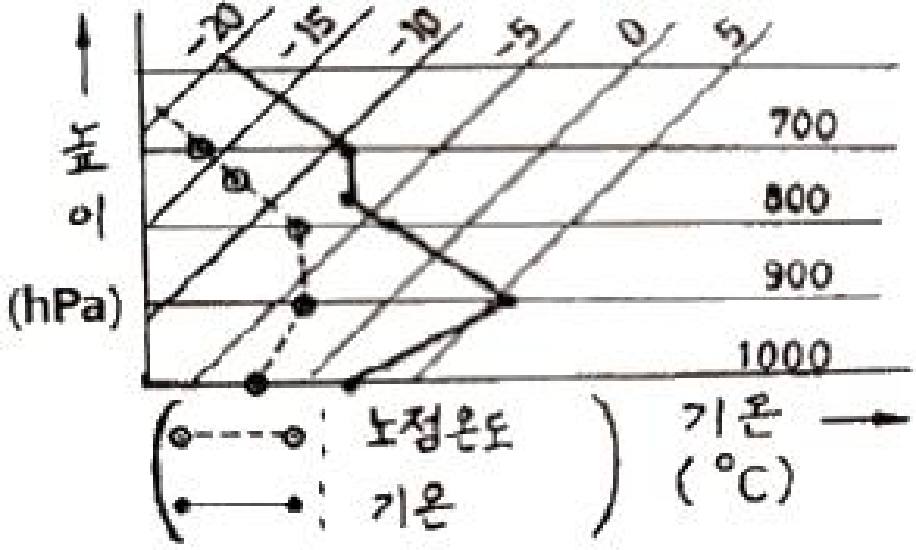
The image depicts a pressure-temperature (P-T) phase diagram with contour lines representing pressure levels (700–1000 hPa) and two distinct data series plotted against temperature (-20°C to 5°C). The diagram includes Korean annotations and symbols to differentiate data series.
### Components/Axes
- **Y-Axis**: Pressure labeled as "압력 (hPa)" with values 700, 800, 900, 1000 hPa.
- **X-Axis**: Temperature labeled as "기온 (°C)" with values -20, -15, -10, -5, 0, 5°C.
- **Contour Lines**: Diagonal lines labeled 700, 800, 900, 1000 hPa, indicating constant pressure levels.
- **Legend**:
- Open circles with dashed lines: "no정온도" (non-temperature condition).
- Filled circles with solid lines: "기온" (temperature condition).
### Detailed Analysis
1. **Contour Lines**:
- Pressure increases diagonally from bottom-left (700 hPa at -20°C) to top-right (1000 hPa at 5°C).
- Lines are evenly spaced, suggesting a linear relationship between temperature and pressure in this range.
2. **Data Series**:
- **"no정온도" (Open Circles)**:
- Points at (-20°C, 800 hPa), (-15°C, 700 hPa), (-10°C, 800 hPa), (-5°C, 900 hPa), (0°C, 1000 hPa).
- Trend: Pressure increases with temperature but shows a dip at -10°C (800 hPa) compared to adjacent points.
- **"기온" (Filled Circles)**:
- Points at (-15°C, 700 hPa), (-10°C, 800 hPa), (-5°C, 900 hPa), (0°C, 1000 hPa).
- Trend: Steady linear increase in pressure with temperature.
3. **Spatial Grounding**:
- Legend is positioned at the bottom-center, clearly associating symbols with data series.
- Data points align precisely with contour lines (e.g., 0°C, 1000 hPa intersects the 1000 hPa contour).
### Key Observations
- Both series converge at (0°C, 1000 hPa), suggesting a critical point or phase transition.
- The "no정온도" series exhibits a non-monotonic trend with a pressure dip at -10°C.
- Contour lines and data points confirm a direct proportionality between temperature and pressure for "기온."
### Interpretation
The diagram illustrates a thermodynamic process where pressure increases linearly with temperature under standard conditions ("기온"). The "no정온도" series may represent an anomalous or non-thermal process, as indicated by its irregular pressure-temperature relationship. The convergence at 0°C and 1000 hPa implies a phase boundary or critical point, potentially marking a transition (e.g., liquid-gas). The dip in "no정온도" at -10°C could reflect experimental variability or a secondary phase behavior not captured by the primary trend.