## Diagram: Inductive Planning Framework
### Overview
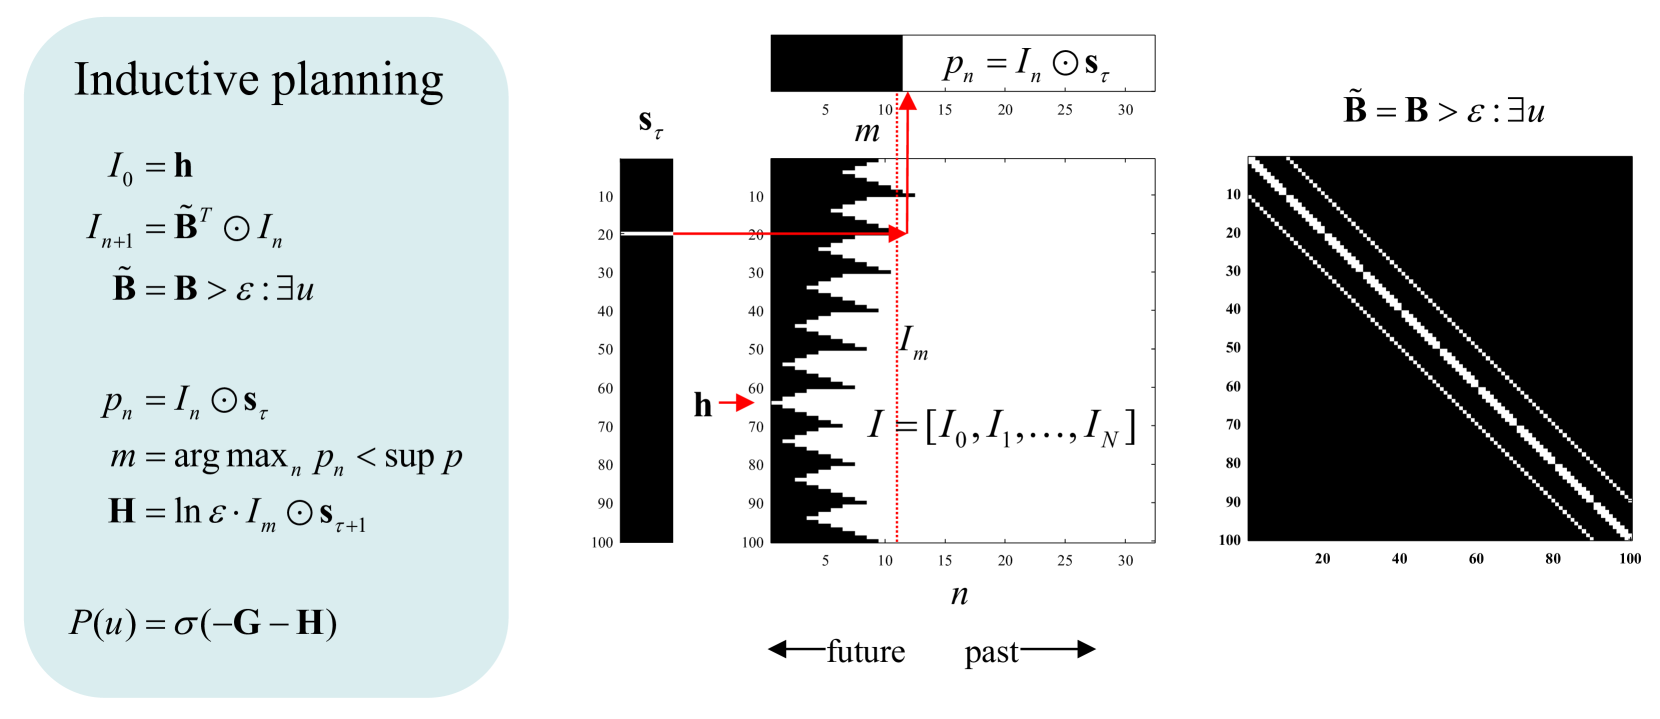
The image presents a technical framework for inductive planning, combining mathematical equations, a decision diagram, and a heatmap. It illustrates a recursive process for optimizing actions over time, with spatial grounding of variables and thresholds.
### Components/Axes
#### Left Section: Equations
- **Variables**:
- `I₀ = h` (initial state)
- `I_{n+1} = B̃^T ⊙ I_n` (recursive update)
- `B̃ = B > ε : ∃u` (thresholded belief)
- `p_n = I_n ⊙ s_τ` (action probability)
- `m = arg max_n p_n < sup p` (optimal action index)
- `H = ln ε · I_m ⊙ s_{τ+1}` (entropy term)
- `P(u) = σ(-G - H)` (policy function)
#### Middle Diagram: Decision Process
- **Axes**:
- Vertical: `s_τ` (state/action space, 10–100)
- Horizontal: `n` (time steps, 5–30)
- **Key Elements**:
- Black bar: Represents `I = [I₀, I₁, ..., I_N]` (sequence of states).
- Red arrow: Points to `I_m` (optimal state at time `m = 10`).
- Dotted line: Marks `p_n = I_n ⊙ s_τ` (action probability threshold).
- Legend: `s_τ` (black) and `p_n` (red).
- Arrows: "future" (left) and "past" (right) temporal orientation.
#### Right Section: Heatmap
- **Axes**:
- X-axis: 20–100 (possibly indices or thresholds).
- Y-axis: 10–100 (same scale as middle diagram).
- **Pattern**: Diagonal white lines suggest a threshold or boundary defined by `B̃ = B > ε : ∃u`.
### Detailed Analysis
1. **Recursive State Update**:
- `I_{n+1}` depends on `B̃^T ⊙ I_n`, indicating a feedback loop where beliefs (`B̃`) modulate state transitions.
- `B̃ = B > ε : ∃u` implies beliefs are filtered by a threshold `ε` and existential uncertainty (`∃u`).
2. **Action Selection**:
- `p_n = I_n ⊙ s_τ` computes action probabilities via element-wise multiplication of state `I_n` and action space `s_τ`.
- `m = arg max_n p_n` identifies the optimal time step `m = 10` (marked by red arrow).
3. **Entropy and Policy**:
- `H = ln ε · I_m ⊙ s_{τ+1}` introduces entropy regularization, balancing exploration/exploitation.
- `P(u) = σ(-G - H)` defines a policy using a sigmoid function, where `G` likely represents a goal term.
4. **Heatmap Interpretation**:
- Diagonal lines in the heatmap correspond to `B̃ = B > ε : ∃u`, suggesting a critical boundary where beliefs exceed a threshold.
### Key Observations
- **Temporal Focus**: The red arrow at `m = 10` highlights the optimal action point in the sequence.
- **Threshold Dynamics**: Both `B̃` and the heatmap diagonal emphasize the role of `ε` in filtering uncertainty.
- **Spatial Grounding**: The middle diagram’s `I_m` aligns with the heatmap’s diagonal, linking state selection to thresholded beliefs.
### Interpretation
This framework models decision-making under uncertainty, where:
1. **Recursive Belief Updates** (`I_n`) refine state estimates over time.
2. **Thresholded Beliefs** (`B̃`) filter noise, ensuring actions (`p_n`) are grounded in reliable states.
3. **Optimal Action Selection** (`m = 10`) balances immediate rewards (`p_n`) and long-term entropy (`H`).
4. The heatmap visualizes how beliefs (`B̃`) partition the state-action space, guiding the policy `P(u)`.
The system prioritizes actions that maximize immediate utility while maintaining robustness to uncertainty (`ε`). The diagonal in the heatmap suggests a critical threshold where beliefs transition from reliable to uncertain, influencing the policy’s exploration strategy.