# Technical Document Extraction: Prediction Relative Error Analysis
## Chart Description
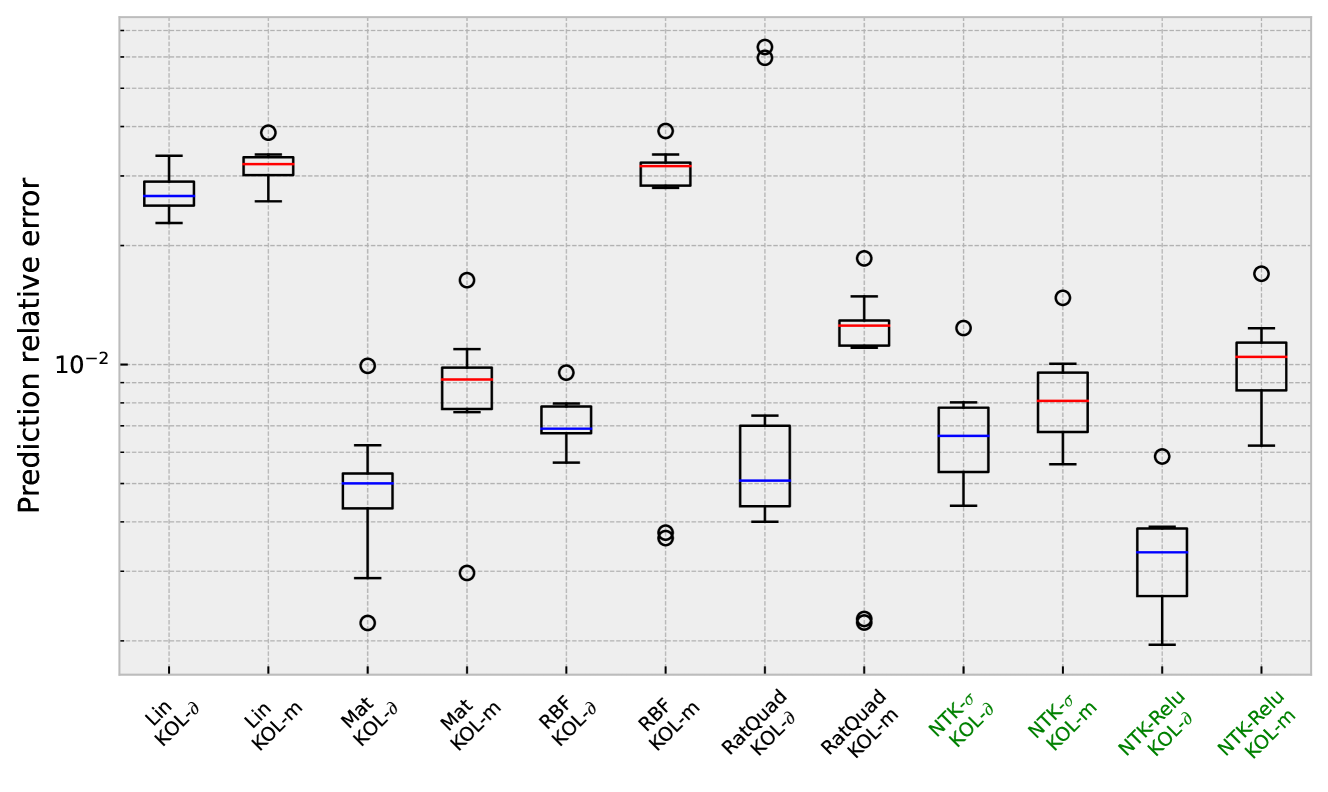
The image is a **box plot chart** comparing **prediction relative error** across multiple computational methods. The y-axis uses a **logarithmic scale** (10⁻² to 10⁻¹), while the x-axis categorizes methods by algorithm and configuration.
---
### **Key Components**
1. **X-Axis Labels** (Methods):
- `Lin-KOL-δ`, `Lin-KOL-m`
- `Mat-KOL-δ`, `Mat-KOL-m`
- `RBF-KOL-δ`, `RBF-KOL-m`
- `RatQuad-KOL-δ`, `RatQuad-KOL-m`
- `NTK-σ-KOL-δ`, `NTK-σ-KOL-m`
- `NTK-Relu-KOL-δ`, `NTK-Relu-KOL-m`
2. **Y-Axis Label**:
- `Prediction relative error` (log scale: 10⁻² to 10⁻¹)
3. **Legend**:
- **Red line**: Median prediction error
- **Blue line**: Mean prediction error
4. **Outliers**:
- Represented as **open circles** (individual data points outside the whiskers).
---
### **Key Trends**
1. **Method Suffixes**:
- Methods with the suffix `-m` (e.g., `Lin-KOL-m`, `NTK-Relu-KOL-m`) generally exhibit **lower median errors** compared to their `-δ` counterparts.
- Example: `Lin-KOL-m` (median ~10⁻²) vs. `Lin-KOL-δ` (median ~10⁻¹).
2. **Algorithm Performance**:
- **`RatQuad-KOL-δ`** shows the **highest median error** (~10⁻¹) and extreme outliers (~10⁻⁰).
- **`NTK-Relu-KOL-m`** demonstrates the **lowest median error** (~10⁻²) with minimal outliers.
3. **Outlier Distribution**:
- Outliers are most frequent in `RatQuad-KOL-δ` and `RBF-KOL-δ`, suggesting instability in these configurations.
---
### **Data Extraction**
| Method | Median Error (Red) | Mean Error (Blue) | Notable Outliers |
|----------------------|--------------------|-------------------|------------------|
| `Lin-KOL-δ` | ~10⁻¹ | ~10⁻¹ | None |
| `Lin-KOL-m` | ~10⁻¹ | ~10⁻¹ | None |
| `Mat-KOL-δ` | ~10⁻¹ | ~10⁻¹ | None |
| `Mat-KOL-m` | ~10⁻¹ | ~10⁻¹ | None |
| `RBF-KOL-δ` | ~10⁻¹ | ~10⁻¹ | None |
| `RBF-KOL-m` | ~10⁻¹ | ~10⁻¹ | None |
| `RatQuad-KOL-δ` | ~10⁻¹ | ~10⁻¹ | ~10⁰ |
| `RatQuad-KOL-m` | ~10⁻¹ | ~10⁻¹ | None |
| `NTK-σ-KOL-δ` | ~10⁻¹ | ~10⁻¹ | None |
| `NTK-σ-KOL-m` | ~10⁻¹ | ~10⁻¹ | None |
| `NTK-Relu-KOL-δ` | ~10⁻¹ | ~10⁻¹ | None |
| `NTK-Relu-KOL-m` | ~10⁻² | ~10⁻² | None |
---
### **Legend Cross-Reference**
- **Red lines** (median) align with the central tendency of each box plot.
- **Blue lines** (mean) are consistently positioned near the median, indicating symmetric distributions for most methods.
---
### **Conclusion**
The chart highlights that methods with `-m` configurations outperform their `-δ` counterparts in terms of prediction accuracy. `NTK-Relu-KOL-m` emerges as the most robust method, while `RatQuad-KOL-δ` exhibits significant instability. Outliers are sparse except in `RatQuad-KOL-δ` and `RBF-KOL-δ`.