## Scatter Plot: Dataset Size vs. Quality Score
### Overview
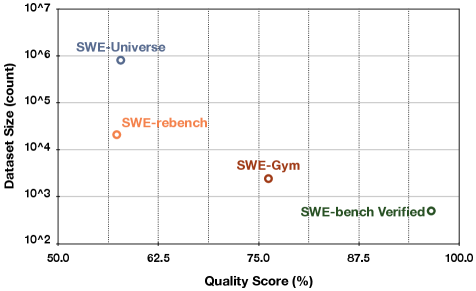
The image is a scatter plot comparing the dataset size (count) on a logarithmic scale to the quality score (percentage) for four different datasets: SWE-Universe, SWE-rebench, SWE-Gym, and SWE-bench Verified. The plot shows the relationship between the size of the dataset and its quality score.
### Components/Axes
* **X-axis:** Quality Score (%), ranging from 50.0% to 100.0% with tick marks at 50.0, 62.5, 75.0, 87.5, and 100.0.
* **Y-axis:** Dataset Size (count), on a logarithmic scale ranging from 10^2 to 10^7. Tick marks are present at each power of 10.
* **Data Points:** Four data points, each representing a dataset.
* SWE-Universe (Blue)
* SWE-rebench (Orange)
* SWE-Gym (Brown)
* SWE-bench Verified (Green)
* **Gridlines:** Vertical and horizontal gridlines are present, corresponding to the tick marks on both axes.
### Detailed Analysis
Here's a breakdown of the data points:
* **SWE-Universe (Blue):** Located at approximately (60%, 10^6). Quality Score is approximately 60%. Dataset Size is approximately 1,000,000.
* **SWE-rebench (Orange):** Located at approximately (61%, 10^4). Quality Score is approximately 61%. Dataset Size is approximately 10,000.
* **SWE-Gym (Brown):** Located at approximately (75%, 10^3). Quality Score is approximately 75%. Dataset Size is approximately 1,000.
* **SWE-bench Verified (Green):** Located at approximately (93%, 10^2). Quality Score is approximately 93%. Dataset Size is approximately 100.
### Key Observations
* There is a general trend of decreasing dataset size as the quality score increases.
* SWE-Universe has the largest dataset size but the lowest quality score among the four datasets.
* SWE-bench Verified has the highest quality score but the smallest dataset size.
* SWE-rebench and SWE-Gym fall in between, with SWE-rebench having a larger dataset size and slightly lower quality score than SWE-Gym.
### Interpretation
The scatter plot suggests an inverse relationship between dataset size and quality score for these four datasets. This could indicate that as more effort is put into verifying and improving the quality of the data, the size of the resulting dataset tends to decrease. This could be due to the removal of noisy or incorrect data points during the verification process. The SWE-Universe dataset, with its large size and relatively low quality score, might represent a dataset collected with less stringent quality control measures. Conversely, SWE-bench Verified, with its small size and high quality score, likely represents a dataset that has undergone rigorous verification.