\n
## Scatter Plot: Dataset Size vs. Quality Score
### Overview
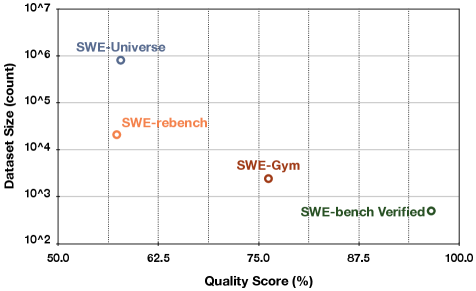
This image presents a scatter plot comparing the dataset size (count) against the quality score (percentage) for four different datasets: SWE-Universe, SWE-rebench, SWE-Gym, and SWE-bench Verified. The plot uses a logarithmic scale for the y-axis (Dataset Size).
### Components/Axes
* **X-axis:** Quality Score (%) - Ranges from approximately 50.0 to 100.0, with tick marks at 50.0, 62.5, 75.0, 87.5, and 100.0.
* **Y-axis:** Dataset Size (count) - Ranges from approximately 10^2 to 10^7, using a logarithmic scale. Tick marks are present at 10^2, 10^3, 10^4, 10^5, 10^6, and 10^7.
* **Data Points:** Four data points are plotted, each representing a different dataset. Each point is marked with a circle and labeled with the dataset name.
* **Datasets:**
* SWE-Universe (Blue)
* SWE-rebench (Orange)
* SWE-Gym (Red)
* SWE-bench Verified (Green)
### Detailed Analysis
* **SWE-Universe:** Located at approximately (60.0, 6.0 x 10^6). This dataset has a relatively low quality score and a very large dataset size.
* **SWE-rebench:** Located at approximately (62.5, 2.5 x 10^4). This dataset has a low quality score and a moderate dataset size.
* **SWE-Gym:** Located at approximately (75.0, 3.0 x 10^3). This dataset has a moderate quality score and a relatively small dataset size.
* **SWE-bench Verified:** Located at approximately (90.0, 1.0 x 10^3). This dataset has a high quality score and a small dataset size.
The data points do not appear to follow a strong linear trend. There is a general inverse relationship between quality score and dataset size, but it is not strict.
### Key Observations
* SWE-bench Verified has the highest quality score and the smallest dataset size.
* SWE-Universe has the lowest quality score and the largest dataset size.
* SWE-rebench and SWE-Gym fall in between, with SWE-rebench having a slightly lower quality score and a larger dataset size than SWE-Gym.
* The logarithmic scale on the y-axis emphasizes the large difference in dataset sizes.
### Interpretation
The plot suggests a trade-off between dataset size and quality. Larger datasets (like SWE-Universe) may be more comprehensive but potentially contain more noise or errors, resulting in a lower quality score. Smaller, verified datasets (like SWE-bench Verified) may have higher quality but lack the breadth of larger datasets.
The positioning of SWE-rebench and SWE-Gym indicates that increasing dataset size does not necessarily translate to increased quality. The difference in quality between SWE-Gym and SWE-bench Verified suggests that the verification process significantly improves the quality of the dataset, even if it means reducing the size.
The plot could be used to inform decisions about which dataset to use for a particular task, depending on the relative importance of dataset size and quality. For example, if high accuracy is critical, SWE-bench Verified would be the preferred choice. If a broader range of scenarios needs to be covered, SWE-Universe might be more appropriate, despite its lower quality score.