## Scatter Plot: Dataset Size vs Quality Score
### Overview
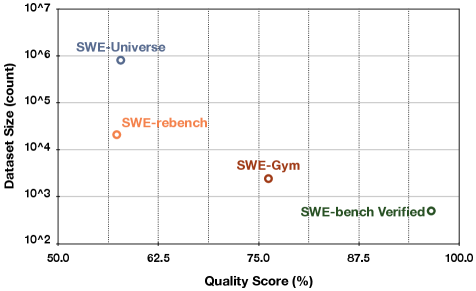
The image is a scatter plot comparing dataset sizes (logarithmic scale) against quality scores (linear percentage scale). Four labeled data points are plotted, each with distinct colors and positions. The chart emphasizes the relationship between dataset size and perceived quality, with notable outliers and trends.
### Components/Axes
- **Y-Axis (Dataset Size)**: Logarithmic scale from 10² to 10⁷ (count).
- **X-Axis (Quality Score)**: Linear scale from 50% to 100%.
- **Legend**: Located on the right, associating colors with labels:
- **Blue**: SWE-Universe
- **Orange**: SWE-rebench
- **Brown**: SWE-Gym
- **Green**: SWE-bench Verified
### Detailed Analysis
1. **Data Points**:
- **SWE-Universe** (Blue): Positioned at (60%, 10⁶). Highest dataset size (1,000,000) with the lowest quality score (60%).
- **SWE-rebench** (Orange): Positioned at (62%, 10⁴). Smaller dataset (10,000) with slightly higher quality (62%).
- **SWE-Gym** (Brown): Positioned at (75%, 10³). Further reduced dataset size (1,000) with a quality score of 75%.
- **SWE-bench Verified** (Green): Positioned at (87%, 10²). Smallest dataset (100) with the highest quality score (87%).
2. **Trends**:
- **Inverse Relationship**: As dataset size decreases (log scale), quality scores increase. This suggests a trade-off between quantity and quality.
- **Logarithmic Clustering**: Dataset sizes span 5 orders of magnitude (10² to 10⁶), while quality scores cluster between 60% and 87%.
### Key Observations
- **SWE-bench Verified** stands out as an outlier: it achieves the highest quality score (87%) with the smallest dataset (100 entries), implying rigorous curation or specialized content.
- **SWE-Universe** dominates in dataset size (10⁶) but has the lowest quality score (60%), indicating potential noise or redundancy.
- The progression from SWE-Universe to SWE-bench Verified shows a clear trend of prioritizing quality over quantity.
### Interpretation
The chart highlights a critical insight: **higher-quality datasets are often smaller and more curated**, while larger datasets may sacrifice quality for breadth. The SWE-bench Verified dataset exemplifies this, suggesting it is a gold-standard benchmark. Conversely, SWE-Universe’s large size and low quality score may reflect a "firehose" approach, prioritizing accessibility over refinement. The intermediate datasets (SWE-rebench and SWE-Gym) demonstrate incremental improvements in quality with reduced size, possibly indicating iterative filtering or domain-specific optimization. This pattern underscores the importance of dataset design choices in balancing scalability and reliability.